
EUR/USD Technical Analysis
The EUR/USD pair has extended its downside trajectory in line with our previous projections, successfully reaching the targeted level of 1.1655 as sellers continue to assert their grip on the short-term landscape.
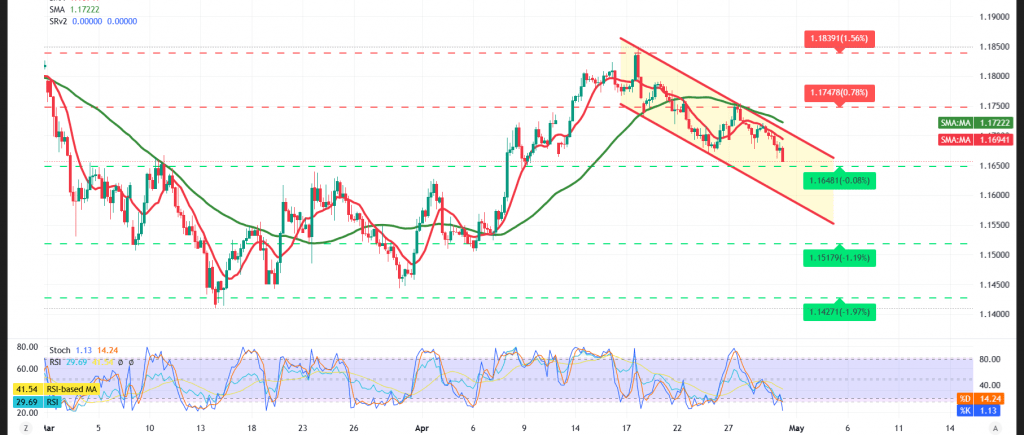
Technical Outlook – 4-Hour Timeframe:
On the short-term horizon, the pair is navigating within a descending price channel, underpinned by the negative pressure exerted by the simple moving averages — a configuration that mirrors the continuation of the prevailing downtrend.
On the flip side, the Relative Strength Index (RSI) has started to display positive signals relative to the underlying price action, raising the prospect of a bullish divergence that could ignite a swift and forceful corrective rebound.
Given the conflicting nature of the technical readings, we favor a watchful approach to price action in order to identify which of the following scenarios will unfold:
Bearish Scenario:
As long as trading remains capped below the psychological resistance at 1.1700, the bearish bias will retain the upper hand, with 1.1640 set as the initial target. A confirmed breakdown beneath this level would pave the way toward 1.1610 as the subsequent objective.
Bullish Scenario:
Conversely, a decisive break above 1.1680 and subsequently 1.1700 would shift the technical landscape in favor of the bulls, opening the path toward 1.1750 as the initial target, followed by 1.1790 as the next upside objective.
Key Economic Events to Watch:
Today’s session features a heavy slate of high-impact economic releases from major economies, which are expected to materially influence market dynamics:
🇬🇧 United Kingdom:
- Interest Rate Decision
- Bank of England Monetary Policy Statement
- MPC Official Bank Rate Vote
🇪🇺 Eurozone:
- European Central Bank Monetary Policy Statement
- ECB Press Conference
🇺🇸 United States:
- Core PCE Price Index
- Advance GDP (Quarterly)
- Risk Disclaimer: Trading CFDs involves risks, and therefore the scenarios outlined above are not a recommendation to sell or buy but rather an explanatory reading of price movement on the chart.
| S1: 1.1640 | R1: 1.1680 |
| S2: 1.1610 | R2: 1.1720 |
| S3: 1.1580 | R3: 1.1750 |


