
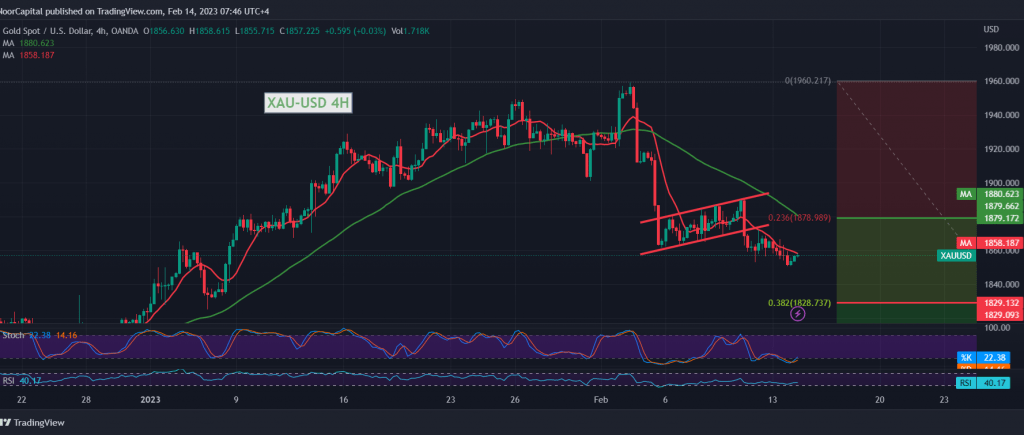
The prices of the yellow metal declined significantly as part of the negative outlook expected during the analysis issued last Friday, heading to touch the second target expected to be achieved at the price of 1854, recording its lowest level at $1850 per ounce.
Technically, and by looking at the 4-hour chart, we find that the effect of the bearish technical formation is still valid and effective, in addition to the signs of the bullish momentum limiting on the short time frames.
With trading remaining below the resistance level of 1865, a bearish trend may be the most likely one during today’s trading, knowing that the decline below 1850 facilitates the task required to visit 1841, and then 1828, the official target of the current downside wave represented by Fibonacci correction 38.20%.
The price should be closely monitored around 1865 because breaching it might lead gold prices to achieve some intraday gains, to retest 1878, the correction of 23.60%, as shown on the chart above.
Note: Markets are awaiting high-impact data issued by the US economy, “US inflation data/consumer price index”, and we may witness high price fluctuations at the release.
Note: Trading on CFDs involves risks. Therefore, all scenarios may be possible. This article is not a recommendation to buy or sell but rather an explanatory reading of the price movement on the chart.
| S1: |