
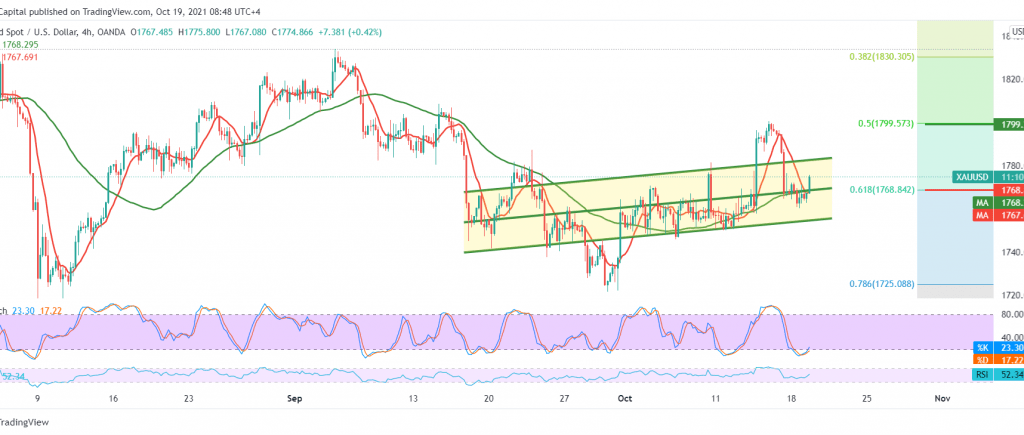
Gold prices found a good support floor near the 1760 level to return to the limited bullish bounce and hovering around its highest level during the early trading of today’s session at 1775.
Looking at the 240-minute chart, we notice the positive motive coming from the 50-day moving average, which meets near the pivotal resistance-into-support at 1768, 61.80% Fibonacci correction, which supports the intraday positivity, in addition to the appearance of positive signs on RSI.
Thus, we may witness a retest of 1780 and 1785, respectively, and the breach of the last level enhances the chances of touching 1795 before attempts to decline again.
If prices return to stability below 1765/1768, the bearish trend will return to dominate the gold’s movements, paving the way to 1755 and 1742, respectively.
Note: The risk level is high.
| S1: 1765.00 | R1: 1780.00 |
| S2: 1755.00 | R2: 1785.00 |
| S3: 1742.00 | R3: 1795.00 |


