
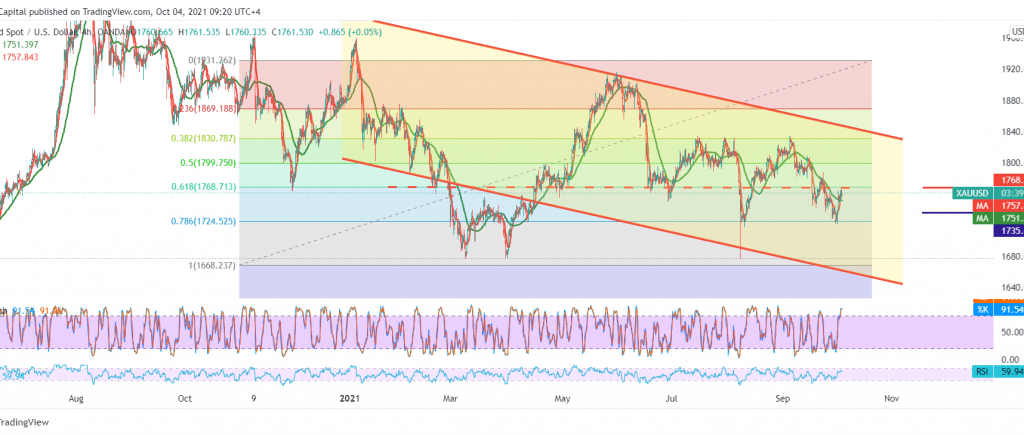
Gold’s movements are witnessing rebound attacks to the upside, which aimed to retest the 1767 resistance level after a, which recorded its lowest level around the 1722 bottom.
On the technical side, we find gold collided with the resistance level of the descending price channel shown on the graph, which lies around 1768 represented by the 61.80% Fibonacci correction, and stochastic started to lose the bullish momentum gradually.
Therefore, the bearish tendency is likely today, targeting 1751 first target and then 1742, knowing that breaking the second level increases negative pressure on gold, so we will be waiting for 1735 official stations.
If the breach of 1768 is confirmed, the 61.80% Fibonacci correction, and most notably 1770, will stop the expected bearish bias and contribute to consolidating gains towards the 1783 areas initially.
.
| S1: 1751.00 | R1: 1767.00 |
| S2: 1742.00 | R2: 1774.00 |
| S3: 1735.00 | R3: 1783.00 |


