
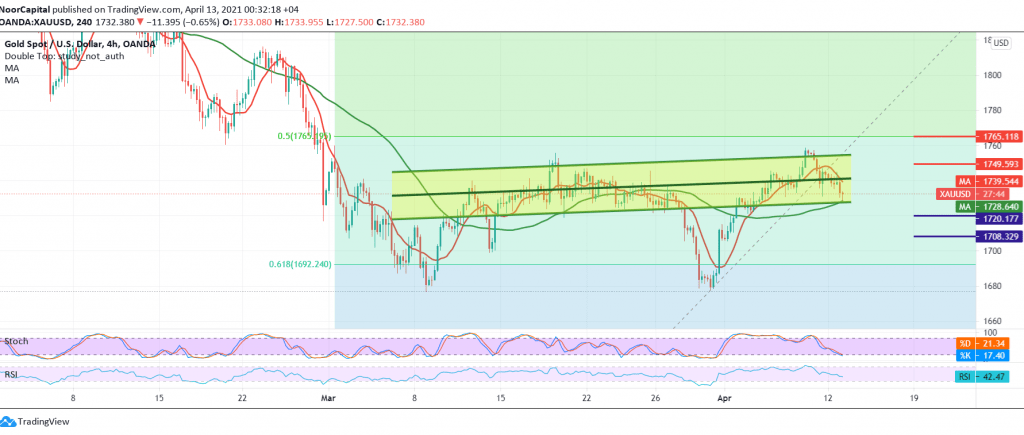
Gold prices succeeded in achieving the first target required to be touched in the previous analysis, located at a price of 1727, recording its lowest price of 1727.
On the technical side today, and with a closer look at the chart at a 240-chart, we find negative signs still dominating the stochastic, and the RSI indicator is stable below the 50 midlines.
From here and with the stability of the intraday trading below the level of 1747 and the most importantly 1750, the bearish scenario remains valid and effective and our view is to continue towards 1720 and after it, 1710/1708 to next stops, taking into account that sub-trading extends gold losses so that the roads are open to visit 1690 Fibonacci retracement 61.80% station An official downward wave.
Activating the bearish scenario depends on trading remaining below 1750, and breaching it will immediately stop the downside attempts, and gold will recover again with the aim of 1765, a 50.0% retracement.
| S1: 1720.00 | R1: 1750.00 |
| S2: 1708.00 | R2: 1768.00 |
| S3: 1690.00 | R3: 1780.00 |


