GBP/USD Technical Analysis
For the second consecutive day, the GBP/USD pair is navigating within a mixed range with a negative tilt, attempting to recoup a portion of the previous losses in the wake of the recent decline. That said, recovery attempts remain limited amid the persistence of negative technical pressures.
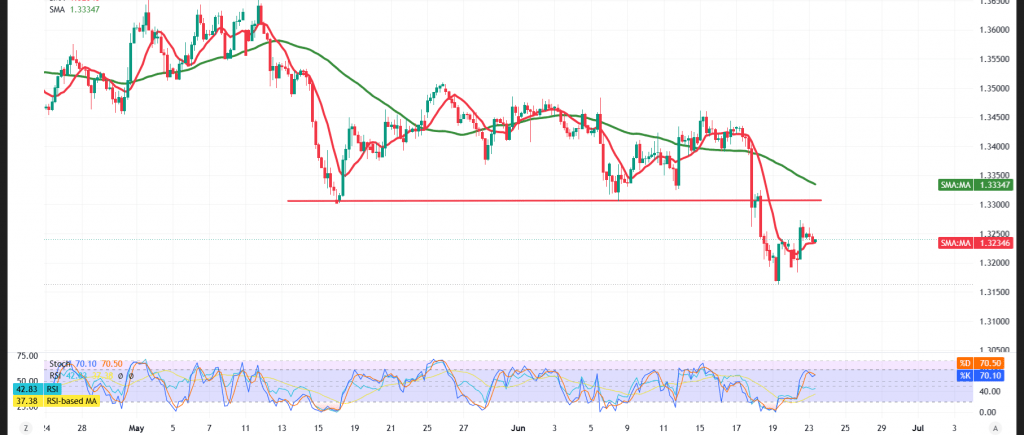
Technical Outlook – 4-Hour Timeframe:
With respect to intraday dynamics, the simple moving averages continue to fulfill their role as effective dynamic resistance zones, persisting in their effort to weigh on the price from above and cap upside rebound opportunities — a configuration that strengthens the prospects of an extended bearish bias across the upcoming trading sessions.
At the same time, the Relative Strength Index (RSI) is broadcasting negative crossover signals after exiting overbought territory — a reading that mirrors the gradual deterioration in bullish momentum and the return of the upper hand to the sellers’ camp.
Sustained trading beneath the key resistance levels lends support to the negative outlook and keeps the prospects of a resumption of the downtrend firmly on the table across the upcoming period.
Expected Scenarios:
Bearish (Most Likely) Scenario:
Sustained trading beneath the 1.3270 resistance ceiling preserves the advantage of the downtrend, with the initial target set at:
- 1.3180
A decisive breach of this level would unlock the path toward further declines targeting:
- 1.3140 as the subsequent level
Bullish Scenario:
Conversely, a decisive breakout above the 1.3280 resistance would encourage the pair to mount a temporary recovery, with:
- 1.3320 emerging as the tentative upside target
Risk Alert: Risk levels remain elevated amid persistent trade frictions and geopolitical tensions — all scenarios should be considered plausible.
Trading CFDs involves risks, and therefore all scenarios may be plausible. The information provided above is not a recommendation to sell or buy but rather an explanatory reading of price movement on the chart.
| S1: 1.3185 | R1: 1.3280 |
| S2: 1.3140 | R2: 1.3320 |
| S3: 1.3090 | R3: 1.3370 |