US Crude Oil (WTI) Technical Analysis
US crude oil futures successfully delivered a powerful technical rebound in line with our previous bullish projections, with prices reaching the formal target of $91.30 before extending the advance to an intraday high of $94.70 per barrel.
Technical Outlook – 4-Hour Timeframe:
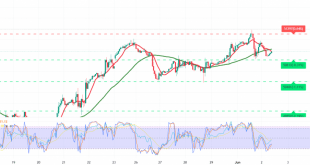
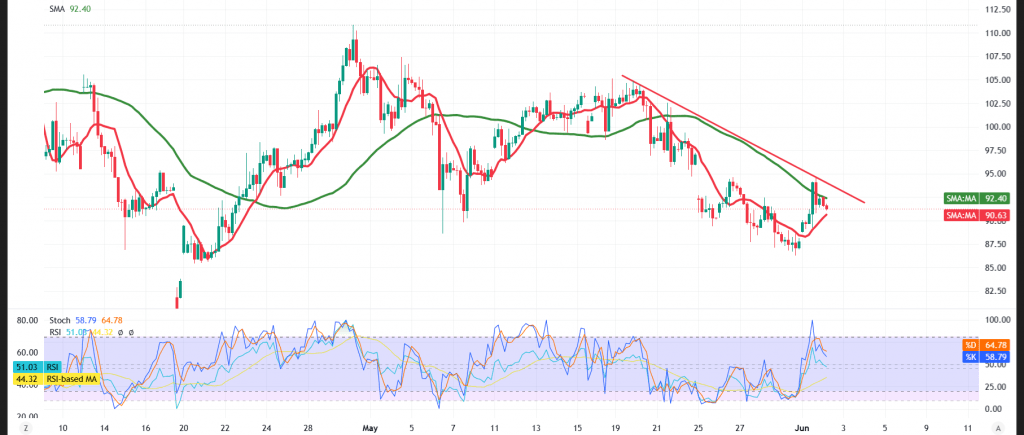
On the short-term horizon, the Relative Strength Index (RSI) has started to broadcast clear negative signals, coinciding with the emergence of a bearish divergence between the price action and the underlying technical indicators. This configuration could amplify the probability of renewed selling pressure and a corrective pullback across the upcoming period.
Meanwhile, prices continue to trade beneath the simple moving averages, which persist in capping the prospects of a full-fledged recovery. Trading likewise continues to unfold along a descending trendline — a dynamic that mirrors the persistence of negative pressure over the short term.
Taken together, these technical readings suggest that the recent rallies may represent nothing more than a corrective move within the broader downtrend, unless prices manage to reclaim the key resistance levels.
Expected Scenarios:
Bearish (Most Likely) Scenario:
Should intraday trading remain capped below the $93.70 resistance ceiling, the contract would face renewed downward pressure, with the initial target set at:
- $90.80
A decisive break below this level would extend the losses toward:
- $88.50 as the subsequent objective
Bullish Scenario:
Conversely, a sustained recovery and stabilization above the $93.70 level would compel prices to resume the upside trajectory at a more accelerated pace, with:
- $94.40 emerging as the initial upside target
Disclaimer: Trading oil carries substantial risk and may not be suitable for all investors.
Risk Alert: Risk levels remain elevated amid persistent trade frictions and geopolitical tensions — all scenarios should be considered plausible.
Trading in CFDs involves high risk, and therefore all scenarios are subject to potential outcomes. The analysis provided above is not a recommendation to buy or sell but rather an illustrative reading of price action on the chart.
| S1: 88.50 | R1: 94.40 |
| S2: 85.70 | R2: 97.50 |
| S3: 82.60 | R3: 100.30 |