
Gold (XAU/USD) Technical Analysis
Gold prices reversed the bullish trajectory projected in our previous technical report — which had hinged on the importance of trading remaining anchored above the $4,486 level. As a reminder, we had previously flagged that the price’s failure to defend this level would bring selling pressure back to the forefront and propel gold toward $4,467 — a scenario that duly materialized, with the yellow metal sliding to a low of $4,447 and thereby invalidating the previously highlighted buy positions.
Technical Outlook – 4-Hour Timeframe:
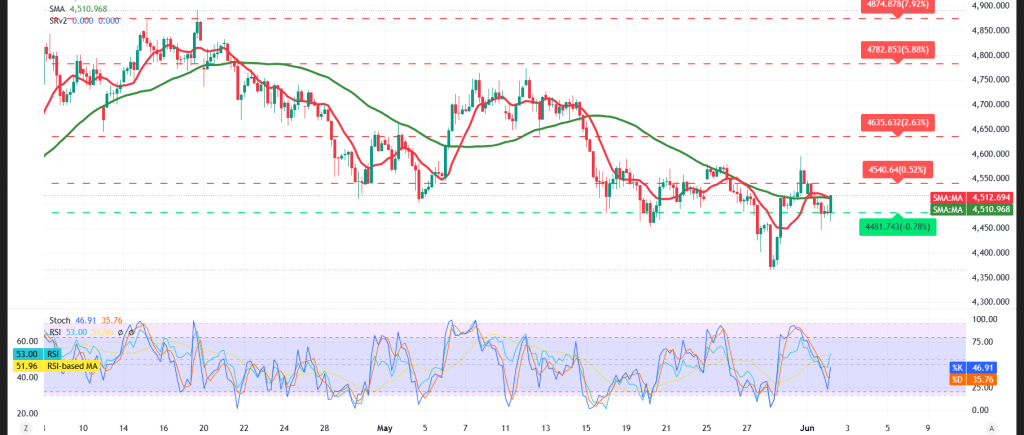
Current intraday price action is working to recapture some constructive momentum after the price had previously dipped into oversold territory, with gold managing to establish a temporary foothold above the psychological $4,500 barrier.
That said, the broader technical picture remains bearish, as the price has returned to trading beneath the simple moving averages, which continue to exert downward pressure. This dynamic coincides with the continuation of price action along a descending trendline, a configuration that lends further weight to the bearish scenario over the short term.
Compounding this picture, the current recovery attempts lack sufficient momentum to validate a genuine trend reversal, which means any rallies should be viewed within a corrective framework unless the key resistance levels are decisively breached.
Expected Scenarios:
Bearish (Most Likely) Scenario:
Sustained trading beneath the pivotal $4,565 resistance ceiling preserves the bearish bias, with the initial target set at:
- $4,460
A decisive break below this level would amplify selling pressure and unlock the door to a broader decline across the upcoming sessions.
Bullish Scenario:
This scenario would be validated should gold deliver a decisive and convincing break above the $4,565 level and sustain trading above it — a development that would supply the price with the impetus to reclaim bullish momentum and target:
- $4,600 as the initial upside objective
Disclaimer: Trading gold carries substantial risk and may not be suitable for all investors.
Risk Alert: Risk levels remain elevated amid persistent trade frictions and geopolitical tensions — all scenarios should be considered plausible.
Risk Disclaimer: Trading CFDs involves risks, and therefore all scenarios may be plausible. The content above is not a recommendation to sell or buy but rather an explanatory reading of price movement on the chart.
| S1: 4457.00 | R1: 4556.00 |
| S2: 4402.00 | R2: 4600.00 |
| S3: 4358.00 | R3: 4655.00 |


