
Gold (XAU/USD) Technical Analysis
The bearish trend dominated gold’s price action at the close of last week’s trading, with the precious metal beginning to apply renewed pressure on the pivotal $4,500 support floor in an attempt to breach it and extend the downside trajectory.
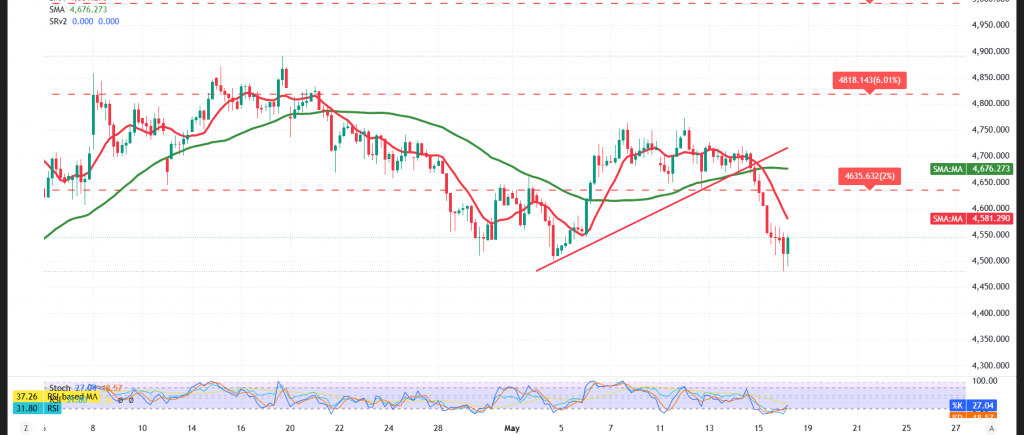
Technical Outlook – 4-Hour Timeframe:
The simple moving averages have forged a clear bearish crossover and continue to weigh on the price, reinforcing the probability of a further extension of the downtrend across the upcoming period.
Adding to the negative picture, the Relative Strength Index (RSI) has successfully exited oversold territory — a development that could supply gold with the technical room to extend its decline, particularly given the evident weakness in buying momentum.
Expected Scenarios:
Bearish (Most Likely) Scenario:
This scenario would be validated should trading remain capped below the $4,600 resistance ceiling, with a decisive break beneath the pivotal $4,500 support required to unlock the path toward:
- $4,458 as the initial target
A confirmed breakdown beneath this level would pave the way for further losses targeting:
- $4,380 as the subsequent objective
Bullish Scenario:
Conversely, this scenario would be confirmed upon a decisive break above the $4,630 barrier, which would give gold the room to claw back a portion of its losses, with the initial target set at:
- $4,746
Disclaimer: Trading gold carries substantial risk and may not be suitable for all investors.
Risk Alert: Risk levels remain elevated amid persistent trade frictions and geopolitical tensions — all scenarios should be considered plausible.
Risk Disclaimer: Trading CFDs involves risks, and therefore all scenarios may be plausible. The content above is not a recommendation to sell or buy but rather an explanatory reading of price movement on the chart.
| S1: 4458.00 | R1: 4643.00 |
| S2: 4376.00 | R2: 4746.00 |
| S3: 4273.00 | R3: 4828.00 |


