
Gold (XAU/USD) Technical Analysis
Gold prices (XAU/USD) exhibited significant volatility during the previous trading session, climbing to an intraday high of $4,727 amid choppy price action.
Technical Outlook – 4-Hour Timeframe:
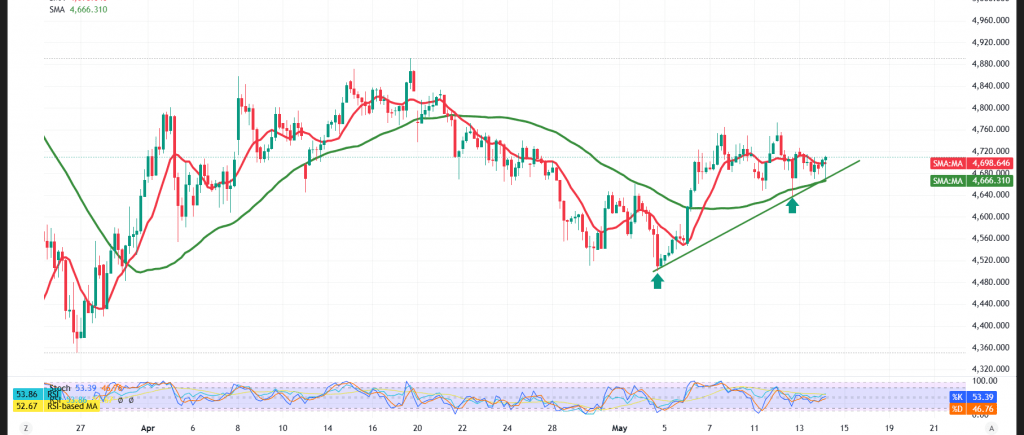
On the short-term horizon, the price continues to draw support from the simple moving averages, which are reinforcing the prevailing upward trajectory.
Adding to the constructive picture, the Relative Strength Index (RSI) has started to display positive crossover signals after emerging from oversold territory — a development that could supply gold with additional bullish momentum across the upcoming sessions.
Expected Scenarios:
Bullish (Most Likely) Scenario:
This scenario would be validated by sustained trading above the $4,670 support floor, which would support the continuation of the uptrend, with the initial target set at:
- $4,740
A decisive break above this level would pave the way for further gains targeting:
- $4,760 as the subsequent objective
Bearish Scenario:
Conversely, this scenario would be confirmed by a decisive breakdown beneath the $4,670 support, which would exert pronounced downward pressure on the metal, with targets emerging at:
- $4,640 as the initial objective
- Followed by $4,611 as the subsequent level
Key Economic Events to Watch:
Today’s session features high-impact economic releases that have the potential to amplify volatility across the financial markets:
🇬🇧 United Kingdom:
- Monthly GDP
🇺🇸 United States:
- Retail Sales
Please note that elevated volatility and pronounced price swings are likely to materialize around the release of these data points.
Disclaimer: Trading gold carries substantial risk and may not be suitable for all investors.
Risk Alert: Risk levels remain elevated amid persistent trade frictions and geopolitical tensions — all scenarios should be considered plausible.
Risk Disclaimer: Trading CFDs involves risks, and therefore all scenarios may be plausible. The content above is not a recommendation to sell or buy but rather an explanatory reading of price movement on the chart.
| S1: 4670.00 | R1: 4730.00 |
| S2: 4639.00 | R2: 4757.00 |
| S3: 4611.00 | R3: 4788.00 |


