
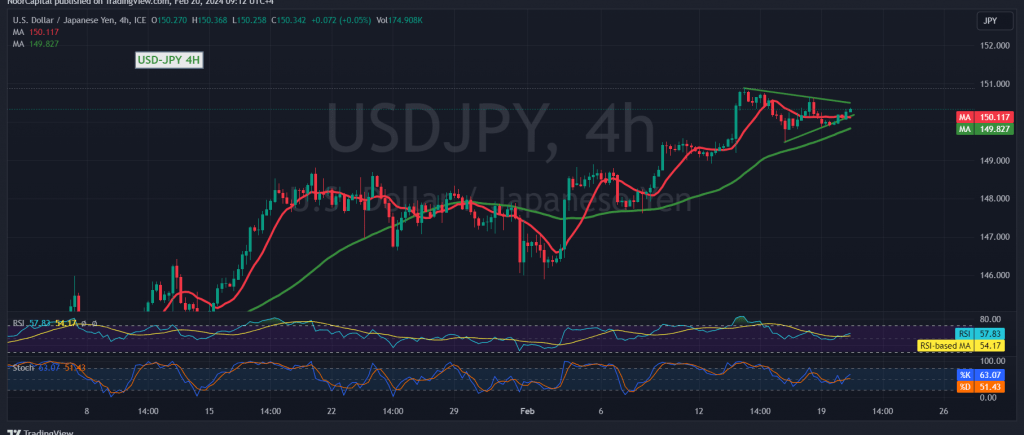
The USD/JPY pair faced a formidable resistance level around 150.80, which led to a slight shift in the anticipated upward bias, resulting in the formation of a mild bearish trend. As of now, intraday movements have stabilized around 150.17.
Technical Analysis Overview:
Upon closer examination of the 240-minute timeframe chart, initial negative signals are beginning to emerge on the Stochastic indicator. However, the 50-day simple moving average continues to support the price from below, hinting at the potential resumption of the upward trend.
Likely Scenario:
Despite the recent resistance encountered, the upward trend remains the most probable scenario for today’s trading session. This is contingent upon the pair maintaining its position above the psychological barrier support level of 150.00. Consolidation above 150.80 would facilitate the completion of the expected ascent towards initial targets at 151.05 and 151.30, with potential extensions towards 150.70 thereafter.
Bearish Correction Possibility:
However, a breach below the 150.00 support level could prompt a temporary bearish correction. In such a scenario, the pair may retest support levels at 147.70 and 149.30 before resuming its upward trajectory.
Warnings Amid Economic Data Releases:
Traders should exercise caution due to the release of high-impact economic data from the British and US economies today. Key data points include monthly gross domestic product figures, retail sales, unemployment benefits, and the New York State manufacturing index. These releases may lead to heightened price fluctuations in the USD/JPY pair.
Risk Assessment:
It’s essential to note that the risk level may be elevated, particularly given the potential volatility induced by economic data releases. Traders should employ appropriate risk management strategies to mitigate potential losses.
Note: Trading on CFDs involves risks. Therefore, all scenarios may be possible. This article is not a recommendation to buy or sell but rather an explanatory reading of the price movement on the chart.
| S1: |