
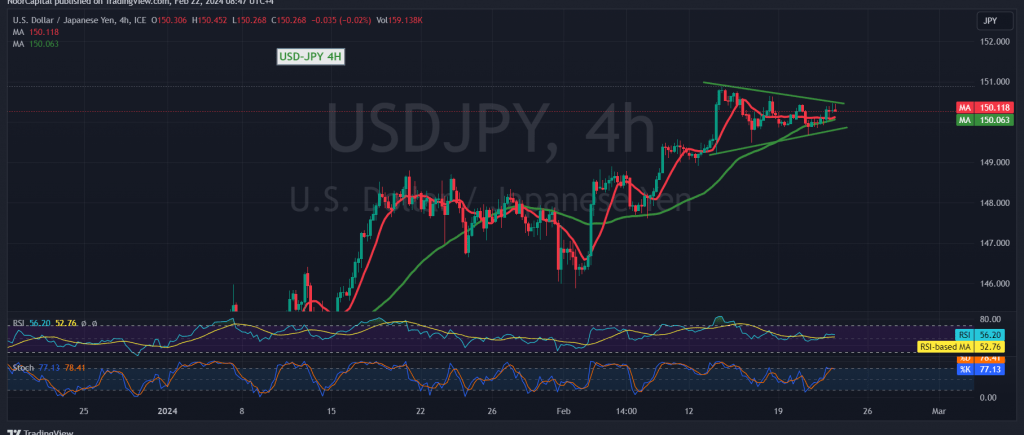
For the second consecutive session, the dollar/yen pair remains ensnared in a narrow-range sideways trajectory, with movements confined between the support level of 149.80 and the resistance level of 150.50.
Technical Analysis Insights
A meticulous examination of the 240-minute timeframe chart elucidates key technical dynamics. The 50-day simple moving average continues to act as a bulwark, providing support for the pair. Conversely, the Stochastic indicator sends conflicting signals, oscillating between positive and negative territory.
Awaiting Price Behavior
Given the incongruent technical signals and the pair’s entrapment between delineated price levels, a watchful stance is prudent. Market participants are advised to closely monitor price behavior, awaiting resolution towards one of two possible scenarios:
Bullish Scenario:
A breach of the 150.50 resistance level serves as a catalyst, bolstering the pair’s gains. Initial targets loom at 150.80 and 151.20, respectively, paving the way for further upward momentum.
Bearish Scenario:
Conversely, slipping below the 149.80 support level applies downward pressure on the pair. In such an event, an initial target of 149.20 emerges, signaling potential for further decline.
Risk Advisory
Amidst the prevailing uncertainty, the risk level remains elevated. Traders are urged to exercise caution and implement robust risk management strategies to mitigate potential losses.
Economic Data Alert
Today’s trading session is marked by the release of high-impact economic data. Anticipate updates on the preliminary readings of the services and manufacturing PMI indices from France, Germany, and the United Kingdom, alongside key indicators from the United States. Expect heightened volatility during these news releases, necessitating vigilance from market participants.
Note: Trading on CFDs involves risks. Therefore, all scenarios may be possible. This article is not a recommendation to buy or sell but rather an explanatory reading of the price movement on the chart.
| S1: |