US Crude Oil Futures Surge, Meeting Expected Targets
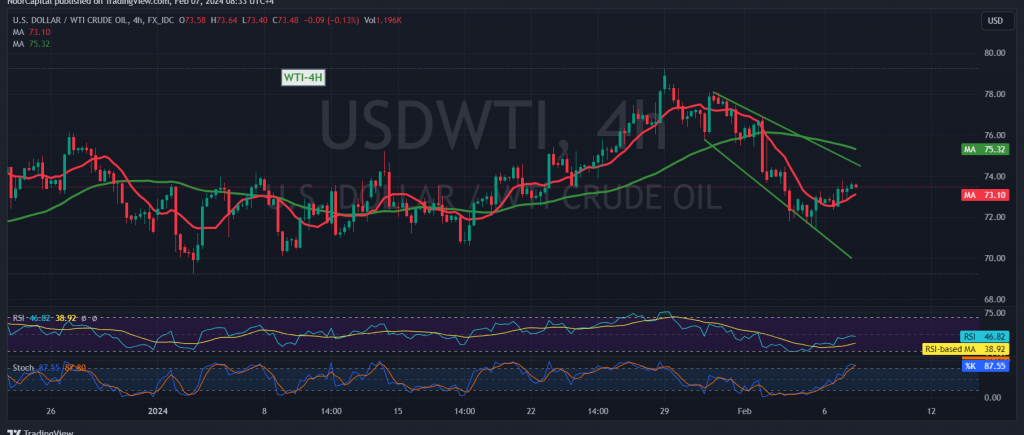
The anticipated upward trajectory in US crude oil futures contracts materialized as forecasted, with prices reaching and surpassing the initial target outlined in our previous technical analysis, touching $73.60 and soaring to a peak of $73.78 per barrel.
Technical Analysis: Positive Signals Amidst Momentum Shifts
A detailed analysis of the technical indicators reveals promising developments. The Stochastic indicator is exhibiting signs of shedding its previous negative signals, while the Relative Strength Index (RSI) is endeavoring to garner positive momentum signals. These shifts suggest a potential continuation of the bullish momentum in the near term.
Potential Scenarios and Targets
With the current technical backdrop, further upward movement is anticipated in the upcoming trading sessions. A retest of the $73.60 resistance level appears probable, and a decisive breach of this level would strengthen the bullish stance, paving the way for extended gains towards $74.00 and subsequently $74.60.
Risk Considerations: Heightened Volatility Amid Geopolitical Tensions
Despite the optimistic outlook, it is essential to acknowledge the inherent risks associated with the oil market. Geopolitical tensions persist, contributing to elevated price volatility. Traders should exercise caution and implement robust risk management strategies to navigate through potential fluctuations effectively.
Conclusion: Navigating the Path Ahead
As US crude oil futures exhibit resilience and momentum, traders are advised to remain vigilant and monitor key support and resistance levels closely. A sustained breach below the critical support level at $72.65 could derail the bullish momentum, ushering in a return to the downside with targets at $71.85 and $71.40. However, continued strength in prices could fuel further upside potential, reinforcing the bullish bias in the short term.
Note: Trading on CFDs involves risks. Therefore, all scenarios may be possible. This article is not a recommendation to buy or sell but rather an explanatory reading of the price movement on the chart.
| S1: |
 Noor Trends News, Technical Analysis, Educational Tools and Recommendations

