
US crude oil futures experienced a notable rally in the previous trading session, nearing the first upward target mentioned in the previous technical report at $78.70. However, the price faced resistance and retreated, reaching a peak of $78.50 per barrel before encountering downward pressure.
Technical Analysis Overview
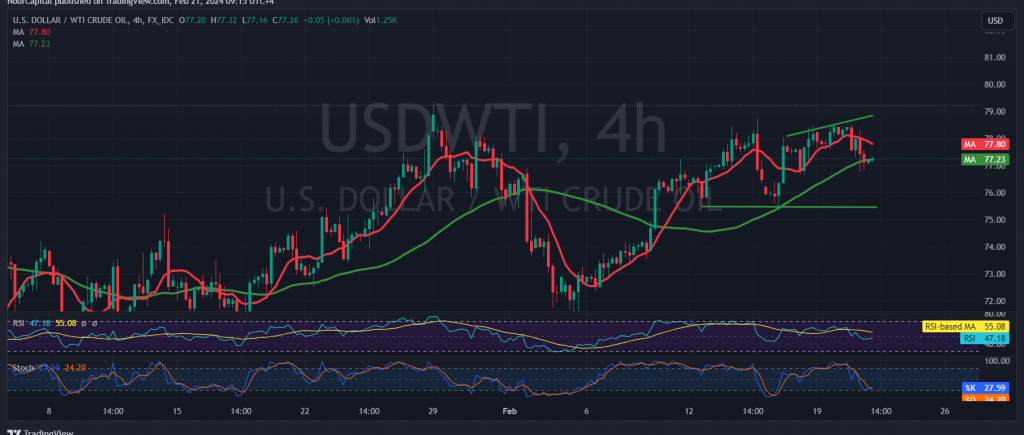
Examining the technical indicators, we observe that the simple moving averages have once again become a barrier to further price advancement. Additionally, intraday trading has remained below the resistance level of $78.20, indicating potential for a downturn. Furthermore, the stochastic indicator is hovering around overbought levels, suggesting a possible reversal. However, the price is attempting to find support above the psychological barrier at $77.00.
Scenario Analysis
Given the conflicting technical signals, it is advisable to closely monitor the price action for potential developments in one of the following scenarios:
- Bearish Scenario: Confirmation of a break below the key support level of $77.00 would exert downward pressure on the price, with targets identified at $76.55 and $75.85.
- Bullish Scenario: If the price manages to stabilize above the resistance level of $78.25, this would signal a positive shift and could prompt a recovery in oil prices towards $79.20 and $79.90, respectively.
Market Caution
Today, heightened volatility is anticipated, particularly with the release of high-impact economic data from the American economy, including the results of the Federal Reserve Committee meeting. Market participants should exercise caution and remain vigilant amid ongoing geopolitical tensions, which may contribute to increased price volatility.
Risk Assessment
Given the uncertain market conditions and the potential for significant price fluctuations, the level of risk remains elevated. Traders and investors should carefully assess the evolving situation and adjust their strategies accordingly to manage risk effectively.
Note: Trading on CFDs involves risks. Therefore, all scenarios may be possible. This article is not a recommendation to buy or sell but rather an explanatory reading of the price movement on the chart.
| S1: |