
Negative trades dominated the prices of US crude oil futures contracts during the previous trading session within a bearish context, gradually approaching the first target to be achieved at the price of 88.55, only to record its lowest level at $88.90 per barrel.
Technically, with a closer look at the 240-minute time frame chart, we notice negative signals beginning to appear on the 14-day Momentum indicator, accompanied by the Stochastic indicator gradually losing upward momentum.
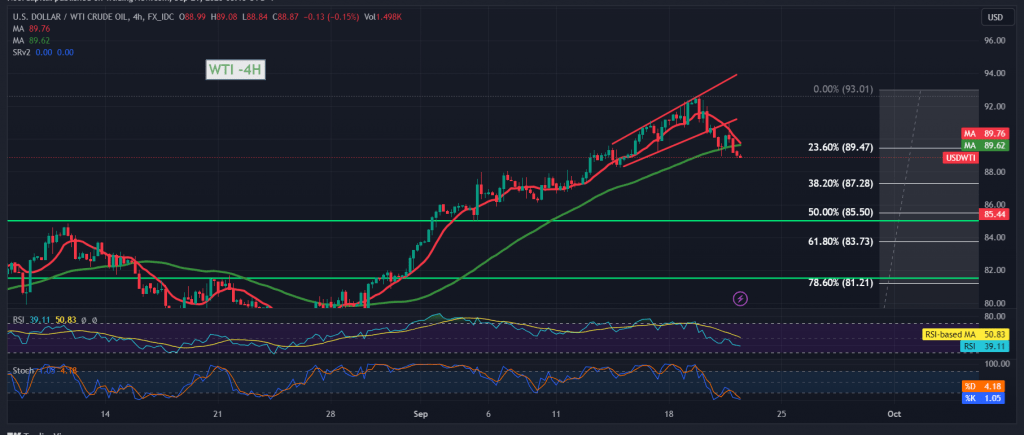
From here, with the stability of intraday trading below the resistance level of 89.50, the 23.60% Fibonacci retracement as shown on the chart, and in general below 90.30, this encourages us to maintain our negative expectations, targeting 88.20 as a first target, and breaking it increases and accelerates the strength of the expected downward correction towards 87.50.
From the top, the jump to the upside and the price consolidating again above 90.30 leads oil prices to complete the official upward path, with targets starting at 91.70.
Warning: Today we are awaiting high-impact economic data issued by the British economy: the Monetary Policy Committee’s vote on interest rates, the interest rate decision, and the monetary policy summary. We are waiting for the “Unemployment Benefits” indicator from the United States of America, and we may witness high price fluctuations at the time of the news release.
Note: Trading on CFDs involves risks. Therefore, all scenarios may be possible. This article is not a recommendation to buy or sell but rather an explanatory reading of the price movement on the chart.
| S1: |