
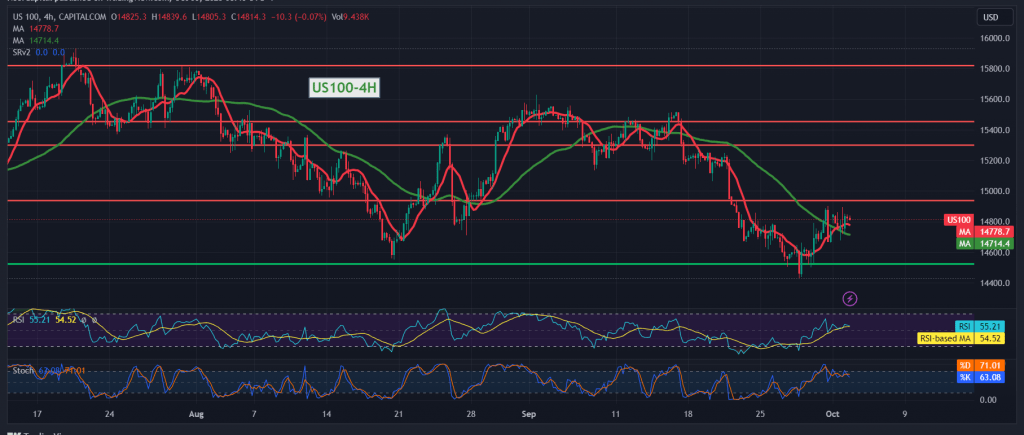
Mixed trading dominated the movements of the Nasdaq index during the previous session’s trading, as it succeeded in breaching the resistance level of 14,730, recording its highest level at 14,895.
On the technical side today, by looking at the 4-hour chart, we find the 14-day Momentum indicator providing positive signals and the stability of the positive momentum coming from the 50-day simple moving average. On the other hand, we find the Stochastic indicator providing negative signals and gradually losing upward momentum.
With conflicting technical signals, we prefer to monitor the price behaviour of the indicator waiting for one of the following scenarios:
To have an upward trend, we need to witness a clear breach of the 14,920 resistance level, and that is a motivating factor that may enhance gains to visit 15,020 and 15,140.
To obtain a downward trend, we must witness a clear and strong break of the support floor of 14,720, targeting 14,695 as the first target, and then 14,580.
Note: The level of risk may be high
Note: Trading on CFDs involves risks. Therefore, all scenarios may be possible. This article is not a recommendation to buy or sell but rather an explanatory reading of the price movement on the chart.
| S1: |