
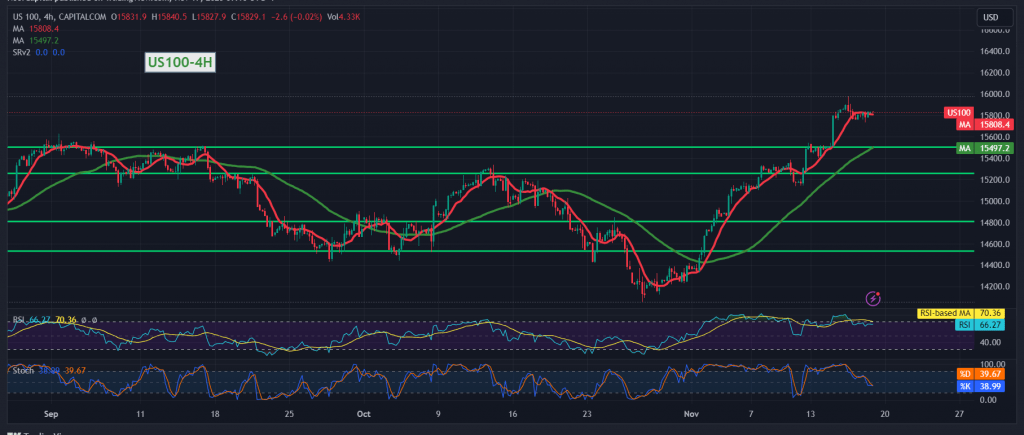
Positive trades prevailed in the Nasdaq index during the recent trading session, leveraging robust support at the price level of 15735.
From a technical standpoint, a detailed analysis of the 4-hour timeframe chart unveils the 50-day simple moving average lifting the price from below, indicating potential for an upward movement. Conversely, the 14-day momentum indicator is issuing negative signals, introducing a level of technical ambiguity.
Given these conflicting signals, it is advisable to closely monitor the price behavior, which may unfold in one of the following scenarios:
- Resumption of the Upward Trend: This would require a clear breach of the 15840 resistance level. Such a breakthrough would act as a catalyst, intensifying gains towards the first target of 15870. Subsequent advances may extend towards 15910.
- Bearish Pressure: If the index slips below 15760, it would come under negative pressure, with initial targets starting at 15695.
A word of caution: The current geopolitical tensions elevate the risk level significantly, potentially leading to heightened price volatility. Investors are advised to exercise caution and stay attuned to market dynamics.
Note: Trading on CFDs involves risks. Therefore, all scenarios may be possible. This article is not a recommendation to buy or sell but rather an explanatory reading of the price movement on the chart.
| S1: |