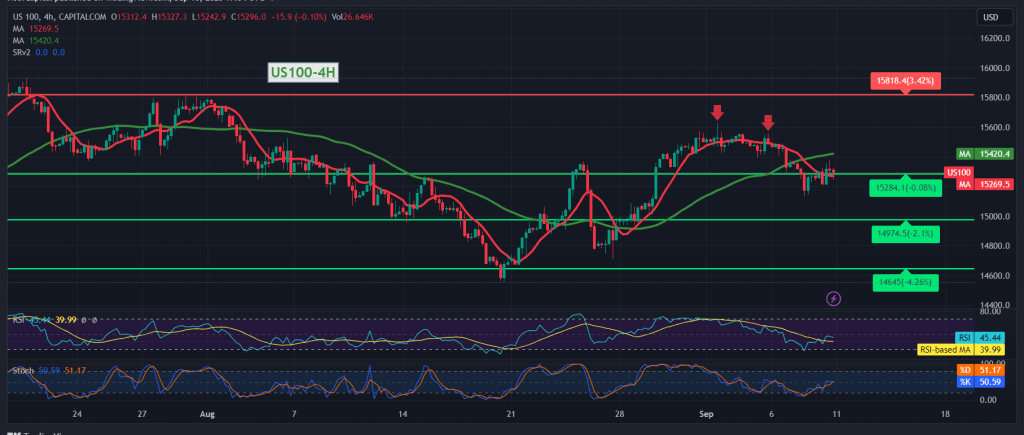
Mixed trading continues to control the movements of the Nasdaq index, recording its lowest level during the last session’s trading at 15,296, as part of attempts to achieve some limited increase.
On the technical side today, by looking at the 4-hour chart, we find the 50-day simple moving average is still an obstacle in front of the index, in addition to the stability of trading below the resistance level of 15,335, and on the other hand, we find the relative strength index trying to provide positive signals accompanied by the stability of trading above 15,270 Generally above 15,240
Given the conflicting technical signals, we prefer to monitor the price behavior of the index to be facing one of the following scenarios:
To get an upward trend, we need to witness the price consolidating above the 15,350 resistance level, which is a catalyst for strengthening the price to visit 15,400 & 15,440.
Sneaking below 15,270, and more importantly 15,240, leads the index to trade negatively, to retest 15,190.
Note: The risk level may be high.
Note: Trading on CFDs involves risks. Therefore, all scenarios may be possible. This article is not a recommendation to buy or sell but rather an explanatory reading of the price movement on the chart.
| S1: |
 Noor Trends News, Technical Analysis, Educational Tools and Recommendations

