
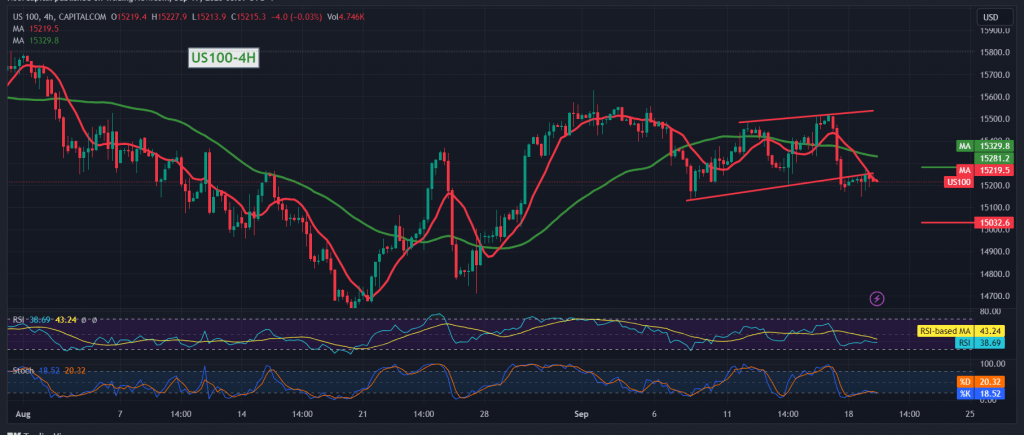
Negative trading dominated the movements of the Nasdaq index at the beginning of this week’s trading last Monday, within the expected bearish context, recording its lowest level at 15,146.
On the technical side today, with a closer look at the 4-hour chart, we find the negative intersection of the simple moving averages supports the continuation of the decline, in addition to the stability of the relative strength index below the midline.
Hence, with daily trading remaining below the resistance level of 15,280, the bearish scenario remains the most preferable during today’s trading session, targeting 15,150 as the first target, knowing that sneaking below the aforementioned level increases and accelerates the strength of the downward trend, so we are waiting for 15,085 and 15,030, respectively.
Only from above, the return of trading stability and price consolidation above 15,280 will immediately stop the proposed bearish scenario and lead the index to retest 15,335.
Note: The risk level may be high.
Note: Trading on CFDs involves risks. Therefore, all scenarios may be possible. This article is not a recommendation to buy or sell but rather an explanatory reading of the price movement on the chart.
| S1: |