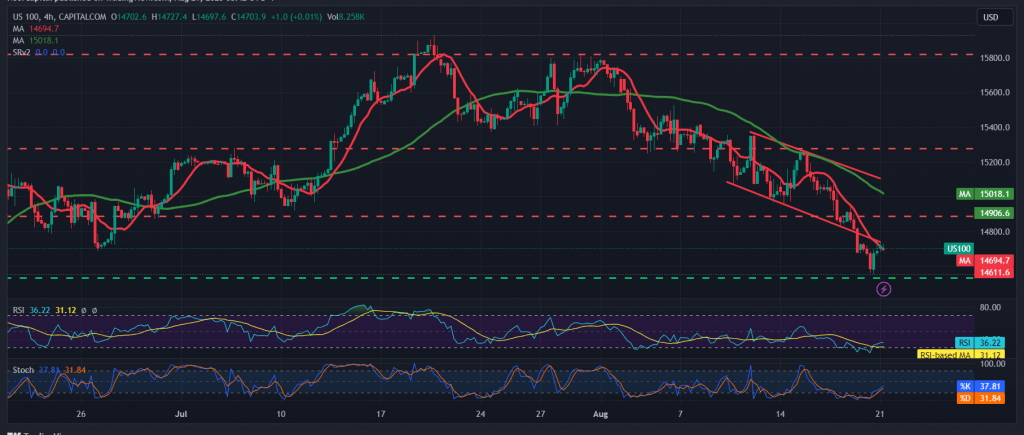
Significant losses incurred the Nasdaq index within the expected negative outlook, surpassing the bearish targets required by last week’s trading at 14,610, recording its lowest level at 14,552.
From a technical point of view, the index’s movements witnessed an upward rebound due to touching the support level of 14,550, which forced the index to compensate for some of its losses. Looking at the 4-hour chart, the stochastic gradually lost bullish momentum, stimulated by the clear negative signs on the RSI on the time frames. short.
Therefore, the bearish scenario remains the most likely during today’s session, with trading steadily below 14,780, targeting 14,585 as a first target, and the losses may extend later towards 14,470 next stations.
The breach to the upside and the price’s consolidation above 14,780 can thwart the downside attempts, and the index begins to recover temporarily to retest 14860 before attempting to decline again.
Note: The risk level may be high.
Note: Trading on CFDs involves risks. Therefore, all scenarios may be possible. This article is not a recommendation to buy or sell but rather an explanatory reading of the price movement on the chart.
| S1: |
 Noor Trends News, Technical Analysis, Educational Tools and Recommendations

