
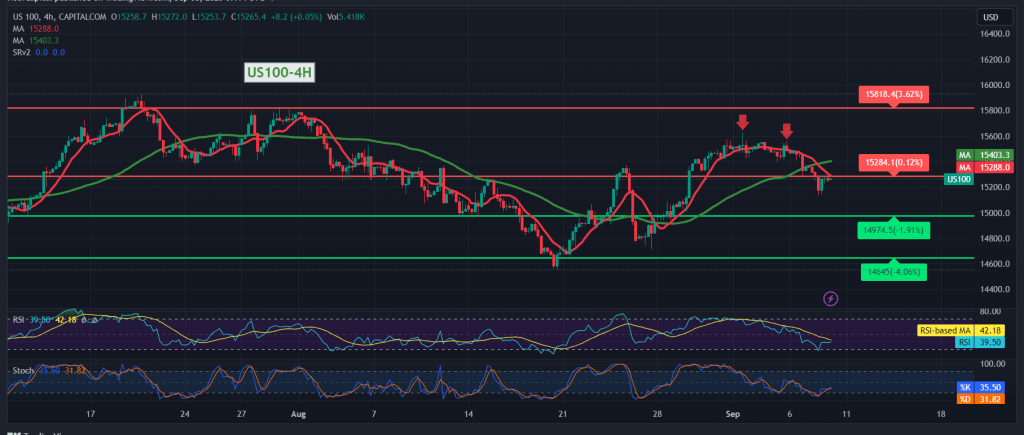
Mixed trading dominated the movements of the Nasdaq index during the previous trading session, recording its highest level of 15,371.
On the technical side today, by looking at the 4-hour time frame chart, we find that the 50-day simple moving average is still an obstacle to the index and trading stability below the 15,335 resistance level.
Therefore, the downward bias is the most likely during today’s session, knowing that confirmation of breaking 15,230 directly opens the door to visit the second target, 15,190, and then 15,120, the next official station.
Activating the proposed bearish scenario requires trading to remain stable below the resistance of 15,335, noting that price consolidation above it will immediately stop the proposed scenario and the index will recover to retest 15410 and 15440.
Note: The risk level may be high.
Note: Trading on CFDs involves risks. Therefore, all scenarios may be possible. This article is not a recommendation to buy or sell but rather an explanatory reading of the price movement on the chart.
| S1: |