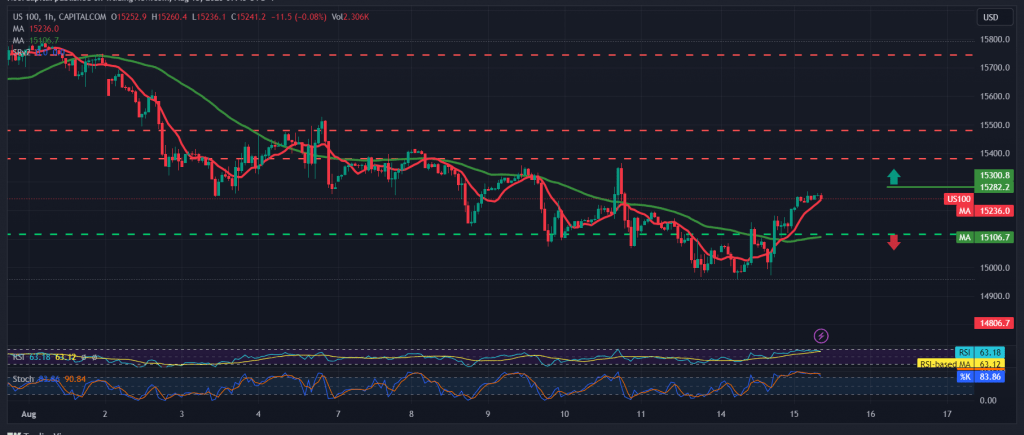
The US Nasdaq index attempts for a bullish rebound, building on the support level of 14,960, pushing the index to achieve some bullish bounce to retest the resistance level of 15,270.
Technically today, looking at the 240-minute chart, the Simple Moving Averages are trying to provide a positive impulse, accompanied by the positive signals from the RSI.
Despite the technical factors that indicate the possibility of a bullish bias, we prefer to witness the breach and consolidation of the price above the resistance level of 15,280, and that may push the index to visit 15,350, a first target that may extend later towards 15,430.
Suppose the index fails to breach the aforementioned level, and returns to trading again below the 50-day moving average around 15110. In that case, we witness the dominance of the official bearish trend with the target of 15050 & 14860.
Note: Today we are awaiting high-impact economic data issued by the US economy “Retail Sales” “New York State Manufacturing Index” and from Canada we await “Monthly Consumer Prices” and from England we await “Change in Unemployment Claims” and we may witness high volatility in prices.
Note: The risk level may be high.
Note: Trading on CFDs involves risks. Therefore, all scenarios may be possible. This article is not a recommendation to buy or sell but rather an explanatory reading of the price movement on the chart.
| S1: |
 Noor Trends News, Technical Analysis, Educational Tools and Recommendations

