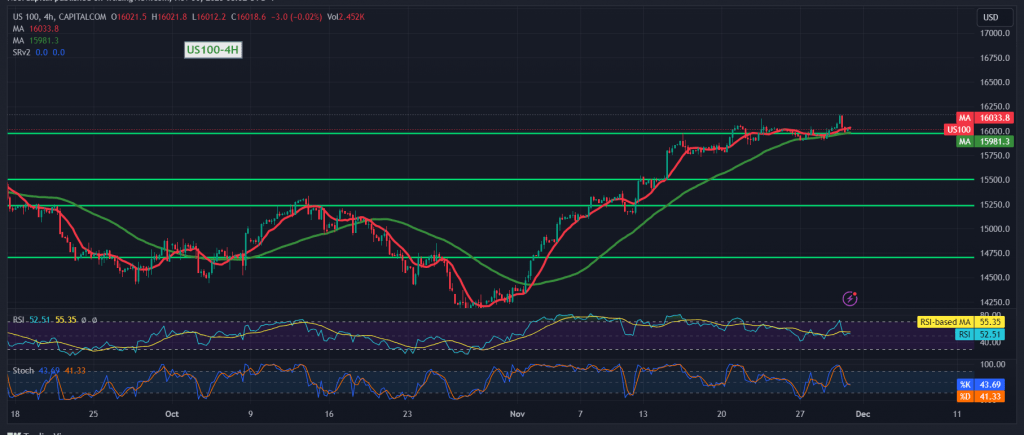
Positive trades dominated the Nasdaq index’s movements during the last trading session, aligning with our anticipated bullish trend. The breach of the 16045 resistance level, as outlined in our analysis, unfolded as expected, paving the way for a visit to 16080 and 16130. The index reached its peak at 16166.
In today’s technical analysis, examining the 4-hour timeframe chart reveals that the index encountered formidable resistance around 16160, prompting a retest of 15980. The 50-day simple moving average exerts upward pressure on the price, complemented by the Prophet’s Force Index striving for upward momentum.
Our outlook remains positive, albeit cautious. It hinges on the index maintaining stability above 15980, with particular emphasis on the 15940 level. This stance targets 16130, and breaching it could extend the gains, setting sights on 16245 as the subsequent station.
Conversely, dipping below 15940 would negate the realization of our projected scenario, subjecting the index to negative pressure with a target of 15860.
Caution: Today, high-impact economic data from the US, particularly the annual “Core Personal Consumer Expenditure Price Index,” is expected. Volatility may surge upon the release of this news.
Risk Warning: The prevailing geopolitical tensions pose a high level of risk, potentially leading to increased price volatility.
Note: Trading on CFDs involves risks. Therefore, all scenarios may be possible. This article is not a recommendation to buy or sell but rather an explanatory reading of the price movement on the chart.
| S1: |
 Noor Trends News, Technical Analysis, Educational Tools and Recommendations

