
In the previous technical report, a neutral stance was maintained due to the exposure of conflicting technical signals. The activation of buying positions was contingent on breaching the resistance level of 15840, which would act as a catalyst, enhancing gains towards 15870, with the highest recorded level being 15880.
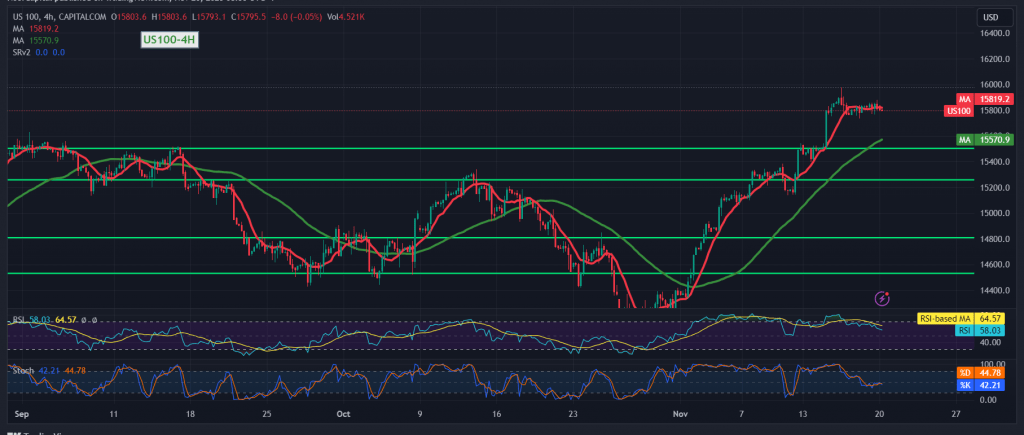
Looking at the technical aspects today, notable signals from the Stochastic indicator have started to indicate temporary negative crossovers on the 4-hour timeframe, while intraday trading remains below the 15860 resistance level.
There is a possibility of a temporary bearish bias in the coming hours, targeting a retest of 15570 before a potential upward movement. It’s important to note that this bearish bias does not necessarily contradict the overall daily upward trend, with initial targets situated around 15930 once the price consolidates above 15860.
On the downside, a breach below 15570 may extend the index’s losses towards 15700 in the subsequent sessions.
A word of caution: The current geopolitical tensions elevate the risk level significantly, potentially leading to heightened price volatility. Investors should exercise caution and stay attuned to market dynamics.
Note: Trading on CFDs involves risks. Therefore, all scenarios may be possible. This article is not a recommendation to buy or sell but rather an explanatory reading of the price movement on the chart.
| S1: |