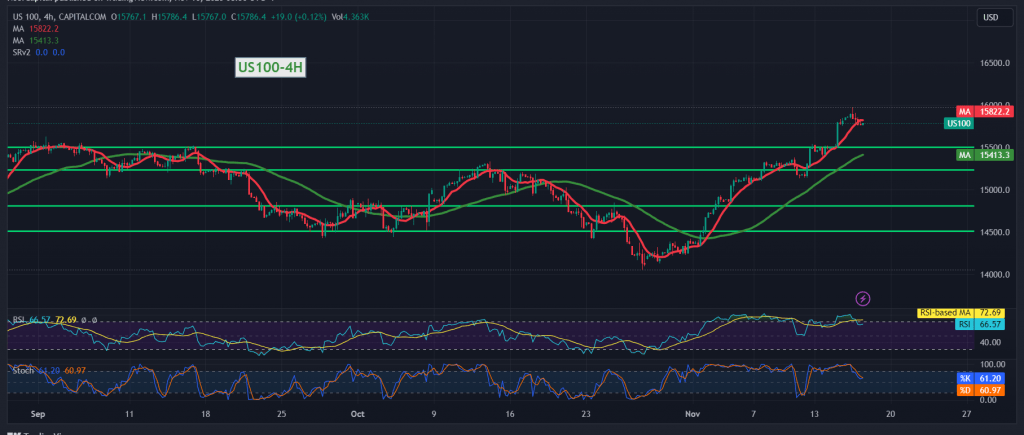
The Nasdaq index was able to touch the first target required to be achieved during the previous technical report, located at 15980, recording its highest level of 15977.
Technically, by looking at the 60-minute time frame chart, we find signs of negativity beginning to appear on the Stochastic indicator, in addition to trading stability below the 15980 resistance level represented by the previous target.
There is a possibility of a downward trend occurring during the coming hours, targeting 15,700 waiting official stations, and we are satisfied with this target only due to the high level of risks around the current levels.
As a reminder, crossing upwards and the price consolidating again above 15920 leads the index to retest 15980, and the price must be monitored carefully around the mentioned level because breaching it may force the index to form an upward attack towards 16060.
Warning: The level of risk is high amid continuing geopolitical tensions, and we may witness high price volatility.
Note: Trading on CFDs involves risks. Therefore, all scenarios may be possible. This article is not a recommendation to buy or sell but rather an explanatory reading of the price movement on the chart.
| S1: |
 Noor Trends News, Technical Analysis, Educational Tools and Recommendations

