
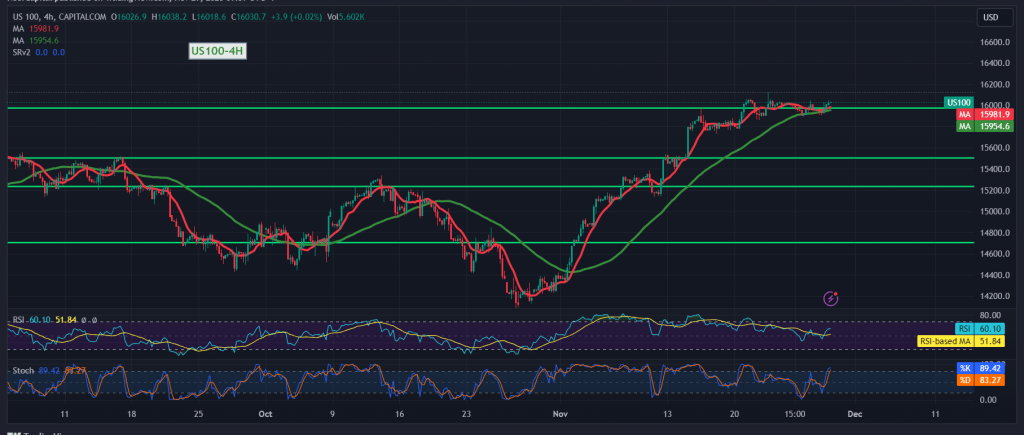
The Nasdaq index experienced mixed trading on the previous day, finding solid support that prompted a retest of the robust resistance level at 16040.
On the technical front today, upon closer examination of the 4-hour chart, the simple moving averages have resumed supporting the price from below, and the 14-day Momentum indicator is attempting to generate positive signals on shorter time intervals.
Our inclination is toward a positive outlook, albeit with caution, contingent on a clear and robust breach of the resistance level at 16045. Such a breakthrough could serve as a motivating factor, potentially paving the way for the index to reach 16080 as the initial target, followed by 16130. This positive view holds unless there is a return to trading below 15940.
Warning: The risk level is elevated, given the ongoing geopolitical tensions, and this may lead to increased price volatility.
Note: Trading on CFDs involves risks. Therefore, all scenarios may be possible. This article is not a recommendation to buy or sell but rather an explanatory reading of the price movement on the chart.
| S1: |