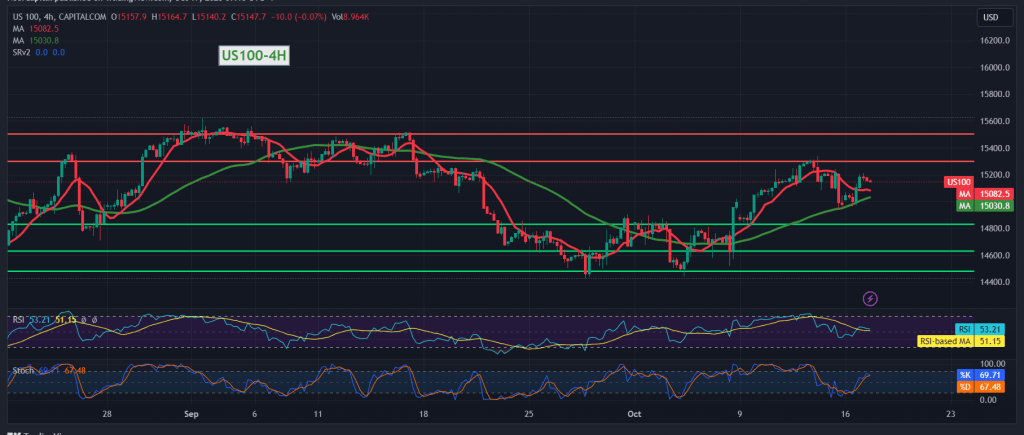
An upward trend dominated the movements of the Nasdaq index during the previous trading session, reflecting the expected downward trend in the last report. As a reminder, we indicated that going upwards and holding the price above 15,040 nullifies the activation of the downward tendency, and we may witness a trading session tending to the positive, with an initial target of 15,165 and 15,260, recording the highest level at 15,210.
On the technical side today, we lean towards positivity but with caution, relying on trading stability above 15040, accompanied by the positive motivation of the 50-day simple moving average, which is accompanied by positive momentum signals.
Therefore, the upward bias is the most likely, provided that we witness a breach of 15,250, targeting 15,350 as the first target, and the gains may extend later to visit 15,500.
Stability below 15,040 invalidates the activation of the bullish tendency, and we may witness a trading session tending to negativity, with an initial target of 14,860, which may later extend towards 14,750.
Note: Today, we are awaiting high-impact economic data in the US, retail sales index and the annual core consumer price index from Canada, and we may witness high volatility at the time of the news release.
Note: The risk level is high.
Note: Trading on CFDs involves risks. Therefore, all scenarios may be possible. This article is not a recommendation to buy or sell but rather an explanatory reading of the price movement on the chart.
| S1: |
 Noor Trends News, Technical Analysis, Educational Tools and Recommendations

