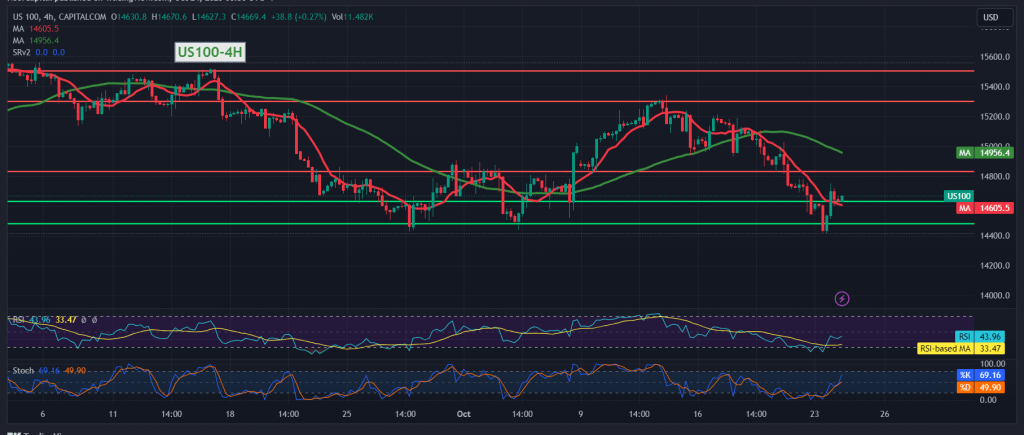
The Nasdaq index only achieved the first downside target at 14470, recording its lowest level at 14,645, which pushed the index to achieve some upward rebound.
Technically, by looking at the 4-hour time frame chart, the Relative Strength Index is trying to provide positive signals, accompanied by the stability of intraday trading above 14,620, which supports positivity. On the other hand, we find negative features still evident on the Stochastic indicator, accompanied by negative pressure from the simple moving averages.
With conflicting technical indicators, we prefer to monitor the price behavior of the indicator to be faced with one of the following scenarios:
Trading above 14,620 to obtain an upward trend. We also need to witness the price consolidating above 14,730, which enhances the chances of a rise towards 14,790 initially.
The negative pressure signals began with breaking the support floor of 14,620 to target 14,580 and 14,530.
Note: Today we are awaiting high-impact economic data from the Eurozone, the services and manufacturing PMI indexes from Germany and France, and the services and manufacturing PMI indexes and unemployment benefits from the UK.
In the US, the markets await the services and manufacturing PMI index, and we may witness some volatility.
Note: Trading on CFDs involves risks. Therefore, all scenarios may be possible. This article is not a recommendation to buy or sell but rather an explanatory reading of the price movement on the chart.
| S1: |
 Noor Trends News, Technical Analysis, Educational Tools and Recommendations

