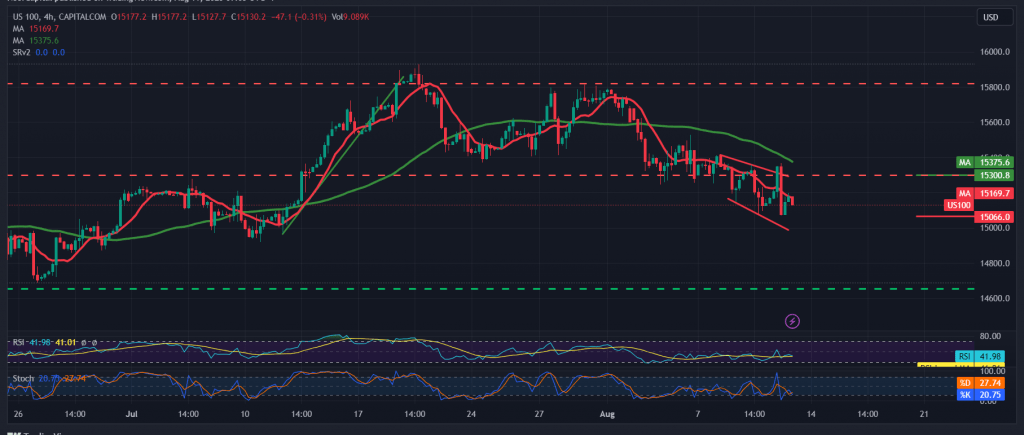
The support level published during the previous report, located at 15,070, could limit the bearish bias for the index to start with negative pressure on the level above.
Today’s technical side indicates the possibility of continuing the decline, relying on the negativity of the simple moving averages, which presses the price from above and is stimulated by the decline in momentum over the short-term intervals.
From here, with trading steadily below 15300/15310, the bearish bias is more likely during today’s session, targeting 15,070, and then 15,010 as the next station, as long as trading is stable below 15,310.
Note: Today we are waiting for high-impact economic data issued by the US economy, “Producer Price Index” and “Initial Consumer Confidence” and from England, we are waiting for the “Gross Domestic Product” indicator, and we may witness high volatility in prices.
Note: The risk level may be high.
Note: Trading on CFDs involves risks. Therefore, all scenarios may be possible. This article is not a recommendation to buy or sell but rather an explanatory reading of the price movement on the chart.
| S1: |
 Noor Trends News, Technical Analysis, Educational Tools and Recommendations

