
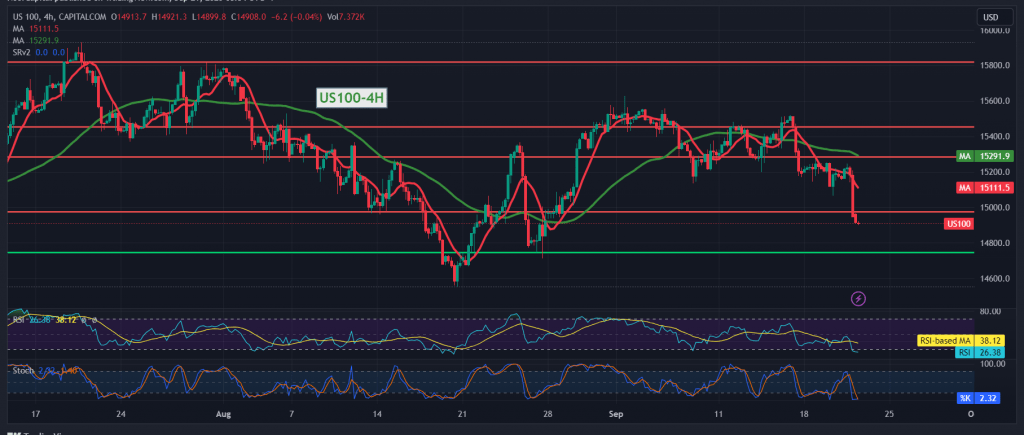
The Nasdaq index fell to achieve significant losses yesterday, as we expected, touching the first official target required to be achieved during the previous technical report at 15,070, recording its lowest level of 14,899.
On the technical side today, with a closer look at the 4-hour time frame, the simple moving averages continue to put negative pressure on the price from above, accompanied by clear negative signals on the 14-day momentum indicator.
Hence, with the stability of intraday trading below the resistance level of 14,980 and in general below 15,140, the bearish scenario remains the most preferable during today’s session trading, targeting 14,790 as the first target, knowing that sneaking below the aforementioned level increases and accelerates the strength of the downward trend so that we will be waiting for 14,670.
Only from above, the return of trading stability and price consolidation above 15,140 will immediately stop the proposed bearish scenario and lead the index to retest 15,365.
Warning: Today we are awaiting high-impact economic data issued by the British economy: the Monetary Policy Committee’s vote on interest rates, the interest rate decision, and the monetary policy summary. We are waiting for the “Unemployment Benefits” indicator from the United States of America, and we may witness high price fluctuations at the time of the news release.
Note: The risk level may be high.
Note: Trading on CFDs involves risks. Therefore, all scenarios may be possible. This article is not a recommendation to buy or sell but rather an explanatory reading of the price movement on the chart.
| S1: |