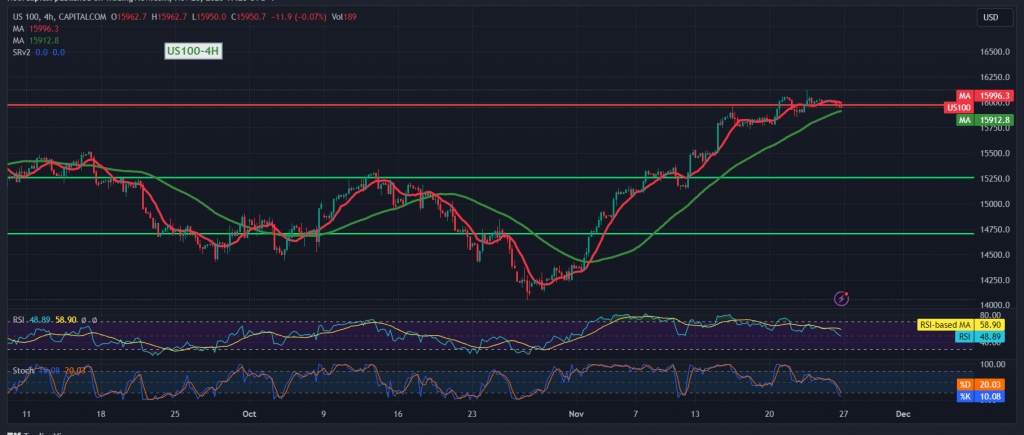
The Nasdaq index faced challenges in achieving a clear breakthrough of the previously identified resistance level at 16040, a condition outlined in the last technical report for the continuation of the upward trajectory.
Upon closer examination of the 4-hour chart from a technical standpoint, indications suggest a loss of upward momentum in the Stochastic indicator, coupled with negative pressure on the simple moving averages. This situation may pave the way for a cautious bearish bias in the upcoming hours. A potential scenario could unfold with a dip below 15920, extending the index’s losses, targeting 15875.
Conversely, the resumption of trading stability above 16010 could halt the bearish trend, initiating a potential upward move towards 16040. It’s crucial to monitor for a breakthrough of 16040, as it could propel the index to further gains around 16070.
Investors are advised to exercise caution given the high level of risk associated with ongoing geopolitical tensions, potentially leading to increased price volatility.
Note: Trading on CFDs involves risks. Therefore, all scenarios may be possible. This article is not a recommendation to buy or sell but rather an explanatory reading of the price movement on the chart.
| S1: |
 Noor Trends News, Technical Analysis, Educational Tools and Recommendations

