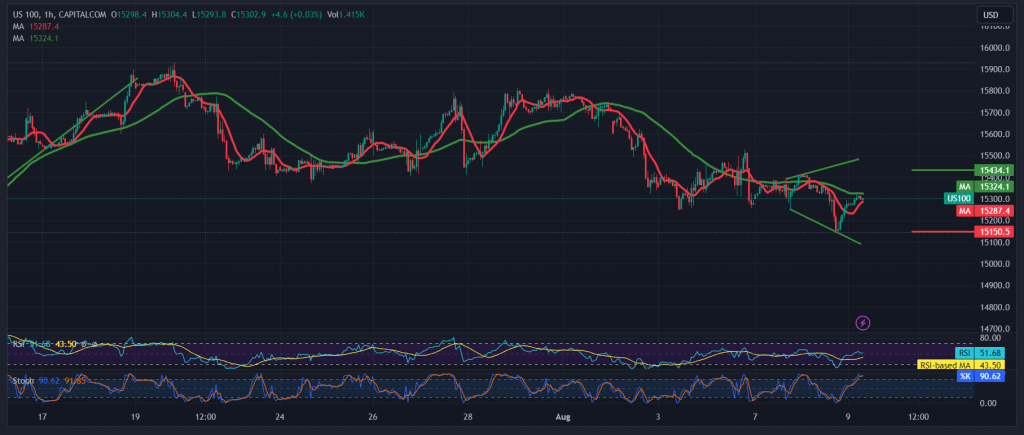
Negative trading dominated the movements of the Nasdaq index within the expected downward path during the previous technical report, touching the official target to be achieved at 15,180, recording its lowest level at 15,160.
The technical side today indicates the possibility of a continuation of the decline. With a closer look at the 60-minute chart, we find that there are attempts to get positive signals from the RSI, accompanied by positive crossover signals from the stochastic, that may push the index to achieve some temporary gains before the start of the decline again.
With the stability of intraday trading above the support level of 15,270, there is a possibility to retest 15,430 as a first target, knowing that the temporary rise does not contradict the bearish daily trend, whose targets are located around 15,160, and extends later to visit 15,100 & 15,050.
Note: Trading on CFDs involves risks. Therefore, all scenarios may be possible. This article is not a recommendation to buy or sell but rather an explanatory reading of the price movement on the chart.
| S1: |
 Noor Trends News, Technical Analysis, Educational Tools and Recommendations

