
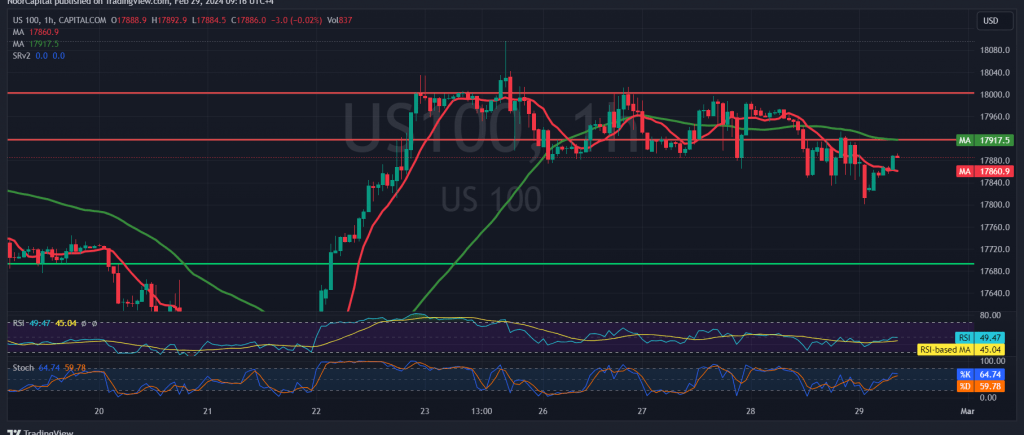
Mixed trading characterized the movements of the Nasdaq index in the previous trading session, attempting to capitalize on the robust support level of 17800, with current levels hovering around 17885.
From a technical perspective today, we are leaning towards negativity, albeit cautiously, contingent upon intraday trading stability below the 17970 resistance level. Additionally, we observe the Stochastic indicator gradually losing bullish momentum.
There exists a possibility of a bearish bias materializing during the day, targeting 17800 as the initial objective. A break below this level would extend the index’s downward trajectory, with subsequent targets around 17710.
Conversely, a decisive upward breakthrough and consolidation of the price above 17970 would promptly negate the proposed bearish scenario, prompting a Nasdaq index recovery. In such a scenario, targets would include 18060 and 18140, respectively.
A word of caution: Today’s trading activity may experience heightened volatility due to the impending release of high-impact economic data from the American economy, including the annual and monthly basic personal consumption spending prices, along with the weekly unemployment benefits. Traders should prepare for potential market fluctuations during this period. Furthermore, ongoing geopolitical tensions contribute to a high level of risk, potentially amplifying price volatility.
Note: Trading on CFDs involves risks. Therefore, all scenarios may be possible. This article is not a recommendation to buy or sell but rather an explanatory reading of the price movement on the chart.
| S1: |