
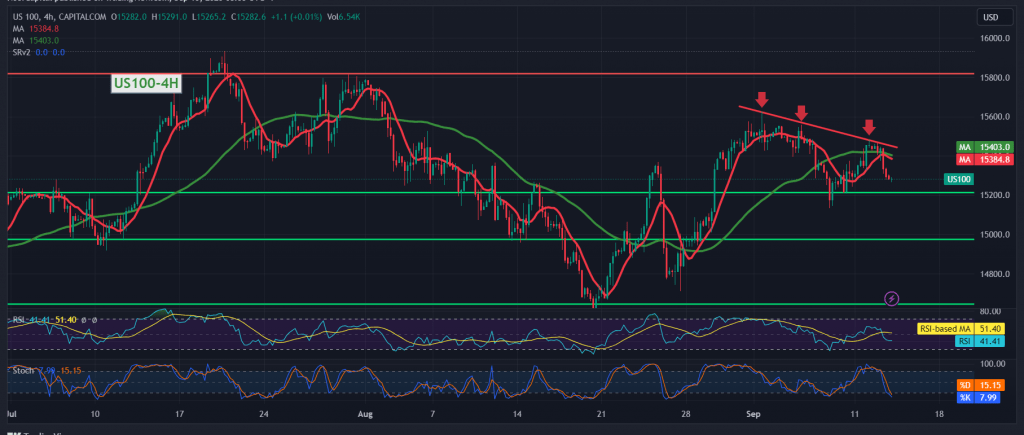
The Nasdaq index reversed the expected upward trend during the previous report, in which we relied on trading stability above 15,330 at the time of the report’s issuance.
Technically, the simple moving averages have returned to pressure the price from above and support the possibility of a decline, this coincides with the clear negative signs on the 14-day momentum indicator and its stability below the 50 midline.
Therefore, with trading remaining below 15,330, and in general below 15,410, the bearish tendency is most likely during today’s trading session, knowing that sneaking below 15,260 facilitates the task required to visit 15,210, and losses may extend later to visit 15,140.
Trading stability and price consolidation above 15,410 will immediately stop the proposed bearish scenario and lead the index to recover operations towards 15,540-15,610.
Note: Consumer Price Index,” and we may witness high price fluctuations when the news is released.
Note: The risk level may be high.
Note: The risk level may be high.
Note: Trading on CFDs involves risks. Therefore, all scenarios may be possible. This article is not a recommendation to buy or sell but rather an explanatory reading of the price movement on the chart.
| S1: |