
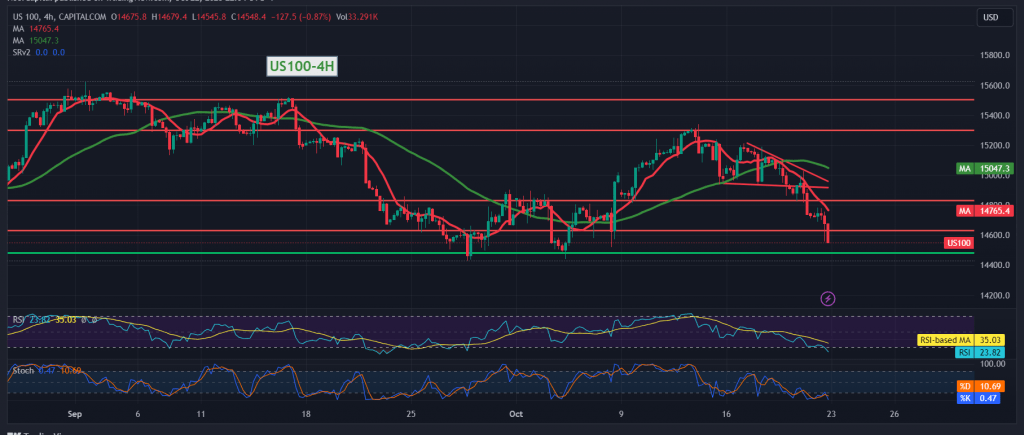
The Nasdaq index reversed the expected upward trend, which we relied on trading stability above 14,810. As a reminder, we indicated that sneaking below 14810 leads the index to record losses starting at 14710, recording its lowest level of 14545.
Technically, we are leaning toward negativity in our trading, relying on breaking the support floor of 14,630, which has been converted into a resistance level, in addition to the negative pressure from the moving average on the 4-hour time frame.
Therefore, we target 14,470 as the first target, knowing that confirmation of breaking the aforementioned level increases and accelerates the strength of the downward trend. We will be waiting for 14,385 unless we witness any trading above 14,630, noting that the price’s consolidation above it leads the index to retest 14,705.
Note: The level of risk is high amid continuing geopolitical tensions, and we may witness high price volatility.
Note: Trading on CFDs involves risks. Therefore, all scenarios may be possible. This article is not a recommendation to buy or sell but rather an explanatory reading of the price movement on the chart.
| S1: |