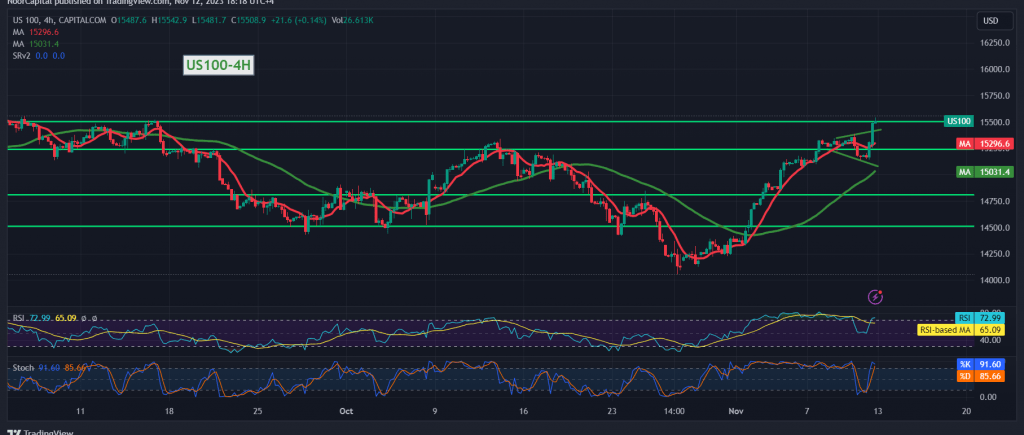
The Nasdaq index surged at the conclusion of last week’s trading session, successfully breaching the 15255 resistance level and reaching its peak at 15542.
From a technical standpoint, a positive outlook is favored, supported by positive signals from the simple moving averages and the Relative Strength Index on short time frames. With daily trading maintaining levels above 15250, the upward trend remains the most probable for the day, targeting 15655 as the initial objective, with potential gains extending further to 15800.
On the downside, if trading stability falls below 15250, it would negate the activation of the proposed scenario and direct the index toward a retest of 14995.
Warning: The risk level is elevated amid ongoing geopolitical tensions, and high price volatility may be witnessed.
Note: Trading on CFDs involves risks. Therefore, all scenarios may be possible. This article is not a recommendation to buy or sell but rather an explanatory reading of the price movement on the chart.
| S1: |
 Noor Trends News, Technical Analysis, Educational Tools and Recommendations

