
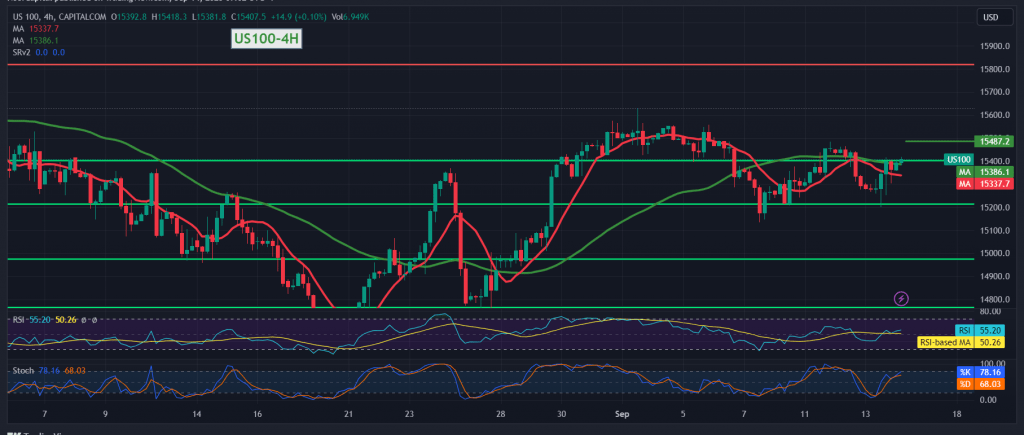
The Nasdaq index achieved the bearish targets published in the previous technical report, touching the first target located at the price of 15,260 and heading to visit the second target of 15,220, recording its lowest level at 15,199.
On the technical side, the index found a strong support floor around 15,200, which forced it to achieve a noticeable upward rebound. By closely looking at the 4-hour chart, we find the simple moving average supporting the rise, accompanied by positive signals from the 14-day momentum indicator.
Therefore, there may be a possibility to resume the upward bias, knowing that the price’s consolidation above 15,420 facilitates the task required to visit 15,480 as the first target, and the gains may extend later towards 15,550.
Trading stability and price consolidation below 15265 will immediately stop the proposed bullish scenario and lead the index to strong selling pressure, targeting 15120 and 15050.
Note: Today we are awaiting highly influential economic data issued by the European economy, “the monetary policy statement of the European Central Bank,” “interest rates on the euro and the press conference of the European Central Bank,” and regarding the American economy, we are awaiting the “producer prices” index and the “retail sales” index.
Note: The risk level may be high.
Note: Trading on CFDs involves risks. Therefore, all scenarios may be possible. This article is not a recommendation to buy or sell but rather an explanatory reading of the price movement on the chart.
| S1: |