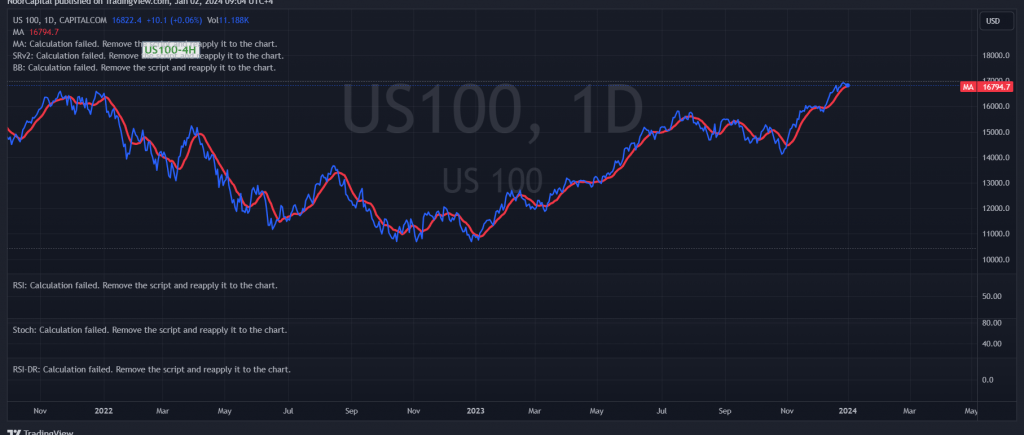
The Nasdaq encountered robust resistance around the 16940 level, effectively curbing its upward momentum and prompting negative movements.
From a technical perspective today, a cautious approach leans towards negativity, considering the downward pressure from the 50-day simple moving average. Additionally, the Stochastic indicator is displaying signs of losing its upward momentum.
Given the current scenario where trading remains below 16930, there is a possibility of a bearish trend in the coming hours, targeting 16735 as the initial objective. A breach below this level would intensify negative pressure, directing the index towards the subsequent target around 16645.
Conversely, a return to trading stability above 16930 would temporarily defer the chances of a decline, leading to a retest of 17070 before the potential resumption of a downward trend.
Traders are advised to exercise caution due to the elevated risk level, particularly amid ongoing geopolitical tensions that could contribute to increased price volatility. Staying vigilant and adjusting strategies in response to market dynamics is recommended.
Note: Trading on CFDs involves risks. Therefore, all scenarios may be possible. This article is not a recommendation to buy or sell but rather an explanatory reading of the price movement on the chart.
| S1: |
 Noor Trends News, Technical Analysis, Educational Tools and Recommendations

