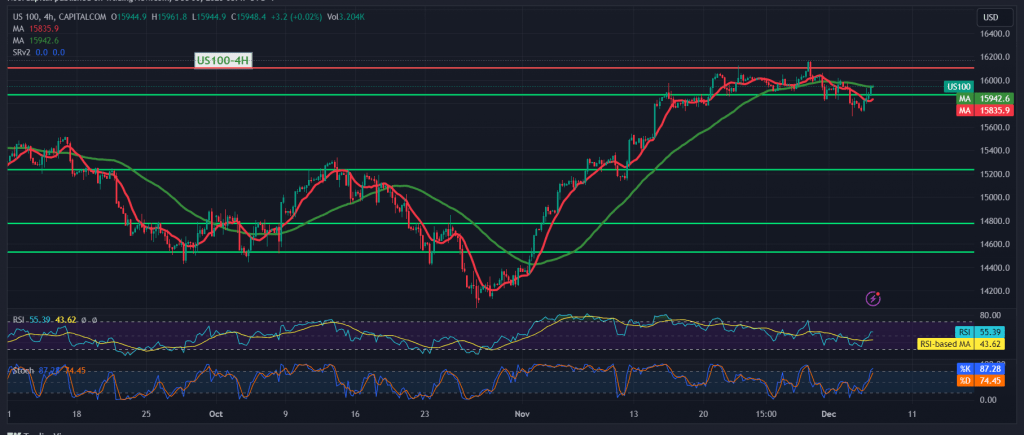
The Nasdaq index successfully reached the initial bearish target highlighted in the previous technical analysis, touching the specified level of 15,760 and marking its lowest point at 15,730.
From a technical standpoint, the index has exhibited an upward rebound following the interaction with the robust support represented by the target at 15,760. A closer examination of the 4-hour chart reveals the index’s return to stability above the 50-day simple moving average, further supported by clear positive signals on the relative strength index.
This sets the stage for a potential upward trend in the coming hours, provided intraday trading remains above 15,880. The consolidation of the price above 15,960 would facilitate a move towards the first target at 16,030. It’s crucial to note that confirming a breach of 16,030 would strengthen and accelerate the upward momentum, paving the way directly towards 16,110. This positive outlook holds as long as the index stays above 15,880.
On the flip side, a dip below 15,880 would direct the index to retest the support level at 15,800.
Investors are cautioned about the elevated risks in the market. Today’s anticipation of high-impact economic data from the American economy, particularly the “change in private non-agricultural sector jobs” from Canada, coupled with the interest statement and rate decision from the Bank of Canada and the press talk by the Governor of the Bank of England, may lead to substantial price fluctuations.
The market’s risk level remains high amidst ongoing geopolitical tensions, adding an additional layer of potential price volatility. Traders are advised to stay informed, exercise caution, and be prepared for dynamic market conditions.
Note: Trading on CFDs involves risks. Therefore, all scenarios may be possible. This article is not a recommendation to buy or sell but rather an explanatory reading of the price movement on the chart.
| S1: |
 Noor Trends News, Technical Analysis, Educational Tools and Recommendations

