
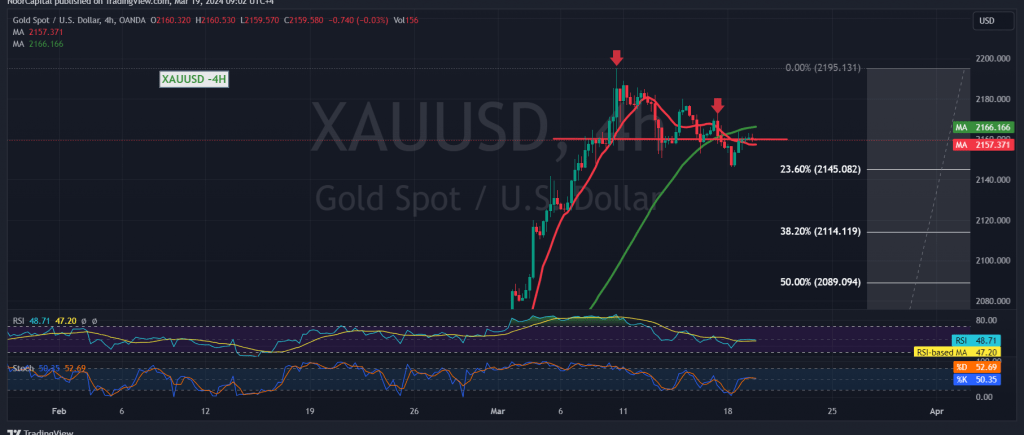
Gold prices experienced mixed trading during the first trading session of the week, testing the main support level around 2145 and maintaining positive stability above it.
From a technical perspective, examining the 4-hour time frame chart reveals that gold remains stable above the previously breached resistance, now acting as a support level at 2145, which coincides with the 23.60% Fibonacci retracement. However, the Stochastic indicator shows a gradual loss of momentum, despite trading stability below the 2170 level.
Given these conflicting technical signals, it’s prudent to monitor price behavior for potential scenarios:
- Breaking below 2145 could trigger a downward correction, with targets at 2131 initially and potentially extending further down to 2114.
- Conversely, surpassing and consolidating the price above 2170 would signal strength and increase the likelihood of reaching 2185 and 2200 as potential targets.
Warning: The current geopolitical tensions contribute to a high level of risk, and heightened price volatility may be observed. It’s important to stay informed and exercise caution when trading.
Note: Trading on CFDs involves risks. Therefore, all scenarios may be possible. This article is not a recommendation to buy or sell but rather an explanatory reading of the price movement on the chart
| S1: |