
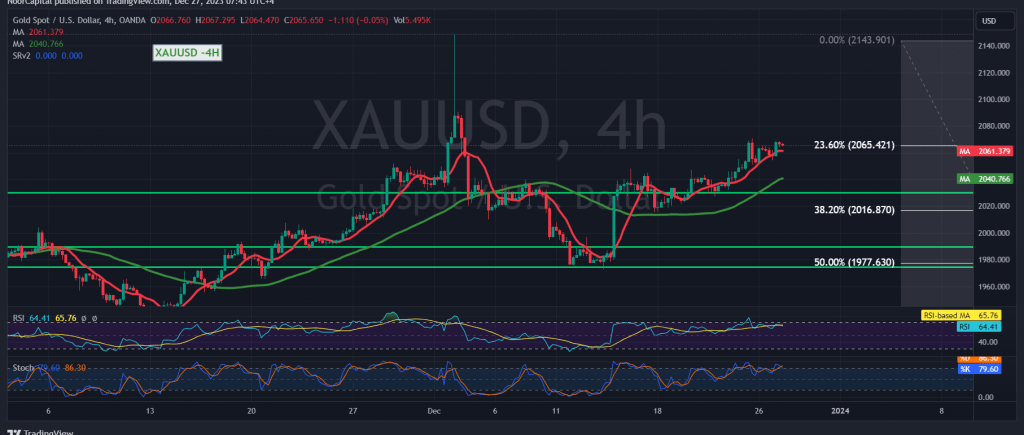
Gold prices have experienced a notable surge, aligning with the positive outlook outlined in the recent technical report issued last Friday. The precious metal reached the official target of $2068 and attained its highest level at $2069 per ounce during yesterday’s trading session. Today’s technical analysis suggests the potential for a continued upward trajectory, backed by positive signals from moving averages and momentum indicators.
Technical Analysis Highlights: The positive momentum in gold prices is supported by simple moving averages that persistently uplift the price from below. Additionally, the 14-day momentum indicator signals favorable conditions for further gains. Despite these encouraging technical factors, a definitive confirmation is awaited, emphasizing the importance of a clear breach and consolidation above $2065, representing the 23.60% Fibonacci retracement.
Anticipated Targets and Consolidation: Once the critical level of $2065 is decisively breached, it is anticipated to enhance and accelerate the strength of the daily upward trend. The next awaited target is $2071, with subsequent gains extending towards the initial level of $2078.
Risk Factors and Support Levels: While the technical analysis points to potential upside, a cautious approach is advised. A temporary negative pressure may emerge if the price closes below $2055 for at least an hour, presenting an opportunity for a retest of the $2045 support level before potential resumption of the upward trend.
Risk Warning: The overall risk level is deemed high, given ongoing geopolitical tensions and the potential for elevated price volatility. Market participants are urged to exercise caution and implement prudent risk management strategies.
Conclusion: Gold prices exhibit positive momentum, and the technical indicators suggest a favorable outlook. Confirmation of a sustained move above $2065 is crucial for a robust continuation of the upward trend. Traders and investors should remain vigilant, considering the heightened risk environment and potential geopolitical developments that may influence gold’s price dynamics.
Note: Trading on CFDs involves risks. Therefore, all scenarios may be possible. This article is not a recommendation to buy or sell but rather an explanatory reading of the price movement on the chart.
| S1: |