
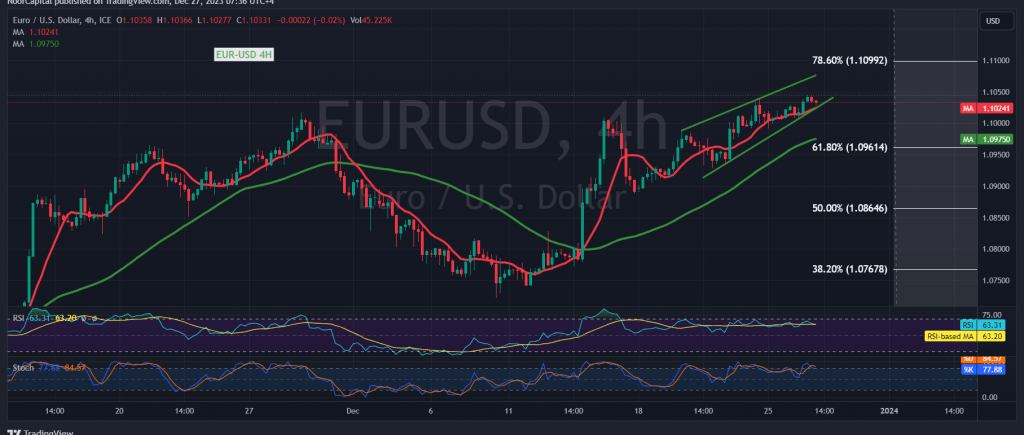
The euro has maintained its upward trajectory against the US dollar, following the anticipated path outlined in the previous technical report. The currency successfully reached the targeted level of 1.1040, touching a peak of 1.1045.
Technical Analysis Overview: Examining the 4-hour time frame chart reveals that the simple moving averages continue to provide support, contributing to the ongoing upward trend in prices. The pair has successfully breached the 1.0960 resistance, now acting as a support level and positioned around the 61.80% Fibonacci retracement, as illustrated on the chart.
Intraday Outlook: As intraday trading remains above 1.0960, there is a potential for the euro to resume its ascent towards the initial target of 1.1070. A successful breach of this level could further strengthen the gains, paving the way for subsequent targets around 1.1090 and 1.1120.
Risk Considerations: A crucial aspect to monitor is the potential for a close below 1.0950 for at least an hour, which could exert negative pressure on the pair. In such a scenario, the focus would shift towards retesting the 1.0900 support level before considering renewed attempts at an upward move.
The euro’s bullish momentum against the US dollar continues, with technical indicators suggesting a favorable outlook. Traders should closely observe the key support level at 1.0960, as a sustained position above this mark could signal a further push towards higher targets. Conversely, a breach below 1.0950 might introduce temporary headwinds, prompting a reevaluation of the pair’s direction. As market dynamics unfold, prudent risk management remains essential for navigating potential fluctuations in the euro-dollar exchange rate.
Note: Trading on CFDs involves risks. Therefore, all scenarios may be possible. This article is not a recommendation to buy or sell but rather an explanatory reading of the price movement on the chart.
| S1: |