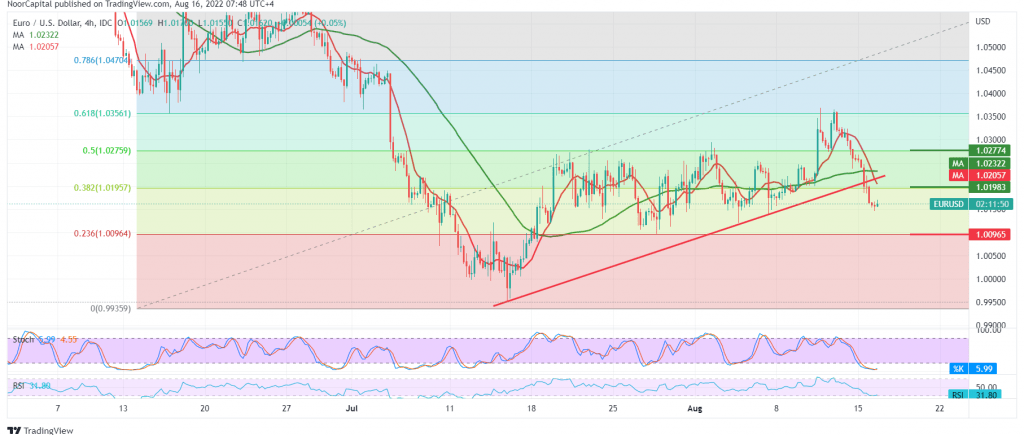
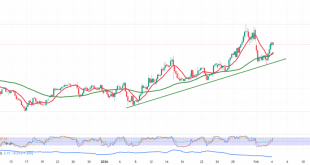
The euro started its first weekly trading with a noticeable decline against the US dollar after it found a pivotal resistance level of 1.0350 that forced it to decline, confirming the breach of 1.0275, and then 1.0200, recording its lowest level yesterday at 1.0147.
Technically and carefully looking at the 4-hour chart, we find the simple moving averages supporting the bearish price curve, in addition to breaking 1.0275, 50.0% Fibonacci correction, the previously broken support now turned into a resistance level.
Therefore, extending the current downside wave is still the preferred scenario, waiting for 1.0100 to touch the next official station, whose bearish target may extend later to visit 1.0075, with the intraday trading remaining below the psychological barrier of 1.0200.
Trading stability above 1.0200 postpones the chances of a decline but does not cancel them, and we may witness a retest of 1.0275 before resuming the decline again.
Note: Trading on CFDs involves risks. Therefore, all scenarios may be possible. This article is not a recommendation to buy or sell but rather an explanatory reading of the price movement on the chart.
| S1: 1.0120 | R1: 1.0240 |
| S2: 1.0075 | R2: 1.0310 |
| S3: 0.9995 | R3: 1.0355 |
 Noor Trends News, Technical Analysis, Educational Tools and Recommendations

