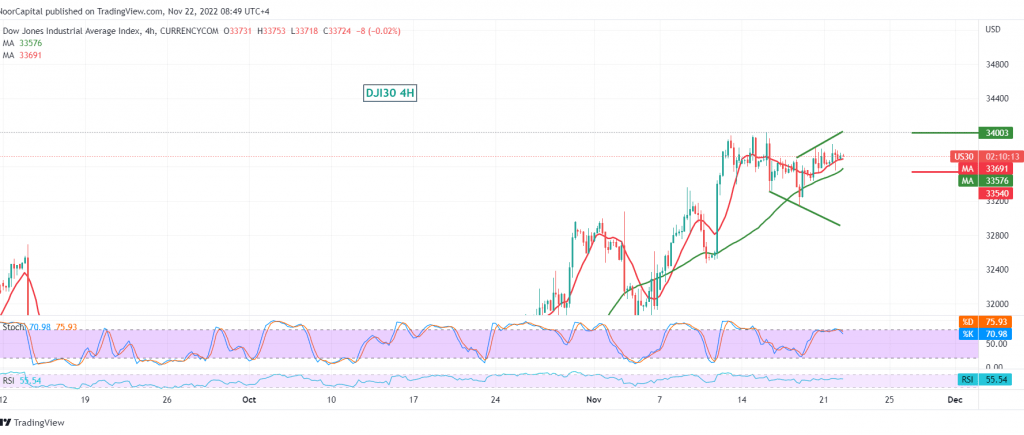
Positive movements dominated the Dow Jones Industrial Average on Wall Street yesterday, recording its highest level during the previous session at 33,865.
Technically, by looking at the 60-minute chart, we find that the simple moving averages are trying to push the price to the upside. We also find the stochastic indicator centred around the overbought areas.
From here, with steady daily trading above the support floor of 33,560, there may be a possibility to continue the rise, but with caution, targeting 33,875, and breaching it will extend the index’s gains, to be waiting for the next 34,000.
Breaking 33,560 can thwart the attempts to climb and puts the index under strong negative pressure, with its target at 33,400.
Note: The risk level is high.
Note: Trading on CFDs involves risks. Therefore, all scenarios may be possible. This article is not a recommendation to buy or sell but rather an explanatory reading of the price movement on the chart.
| S1: |
 Noor Trends News, Technical Analysis, Educational Tools and Recommendations

