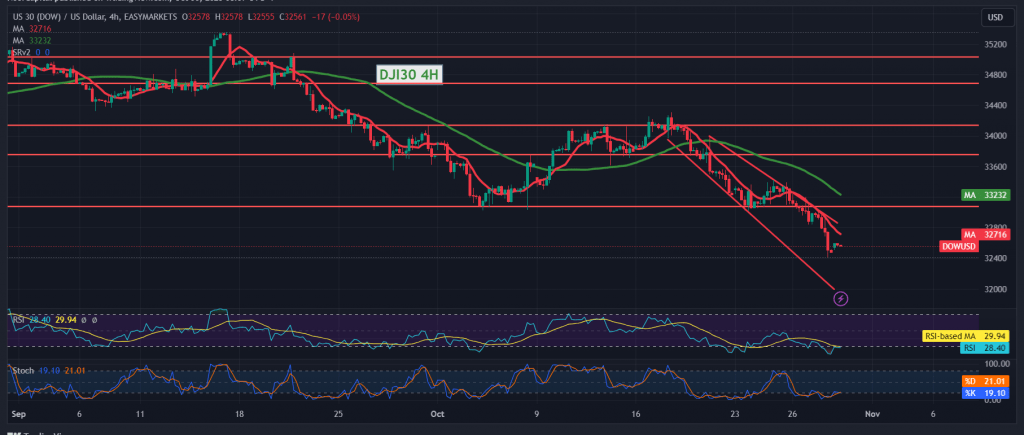
Last week, the Dow Jones Industrial Average experienced substantial losses, aligning with the anticipated downward trend outlined in the previous technical report. The index hit the targeted levels at 32810 and 32730, reaching its lowest point at 32410.
Analyzing the 4-hour timeframe chart reveals persisting negative pressure from the intersecting moving averages and clear signals from the 14-day momentum indicator. Intraday stability below the 33710 resistance level suggests a likely continuation of the bearish trend, with an initial target at 32315. A breach could intensify the downward momentum, with 32065 as the subsequent goal.
Conversely, a return to stability above 32710 might temporarily halt the decline, potentially leading to positive movements and a retest of 32910.
Investors are cautioned due to elevated risks stemming from ongoing geopolitical tensions, which could result in heightened price volatility.
Note: Trading on CFDs involves risks. Therefore, all scenarios may be possible. This article is not a recommendation to buy or sell but rather an explanatory reading of the price movement on the chart.
| S1: |
 Noor Trends News, Technical Analysis, Educational Tools and Recommendations

