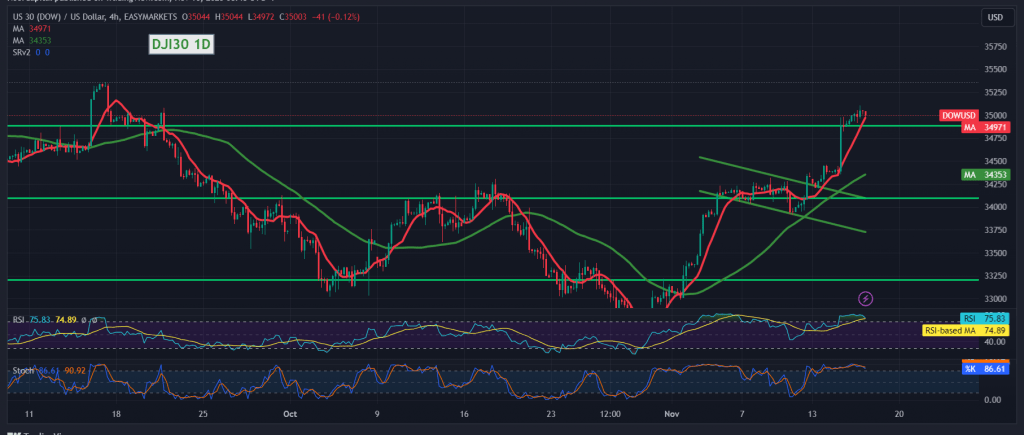
Introduction: Positive momentum continued to drive the Dow Jones Industrial Average on the New York Stock Exchange, reaching an all-time high of 35,103.
Technical Analysis: Examining the 4-hour chart, the simple moving averages support the daily upward trend. The Relative Strength Index (RSI) is also reinforcing the bullish sentiment.
Key Levels:
- Support Level: Intraday trading above 34,860.
- First Target: 35,170.
- Breakout Level: Breaching 35,170 could open the way towards 35,280.
Implications and Risks:
- The ongoing geopolitical tensions elevate the risk level, making it crucial for investors to remain vigilant.
- A breach below 34,860 might postpone the upward trend, putting the index under negative pressure with a potential retest of 34,660.
Conclusion: With the Dow Jones displaying robust bullish momentum, investors are eyeing key levels for potential gains. The geopolitical landscape adds an element of risk, emphasizing the importance of monitoring the market closely.
Note: Trading on CFDs involves risks. Therefore, all scenarios may be possible. This article is not a recommendation to buy or sell but rather an explanatory reading of the price movement on the chart.
| S1: |
 Noor Trends News, Technical Analysis, Educational Tools and Recommendations

