
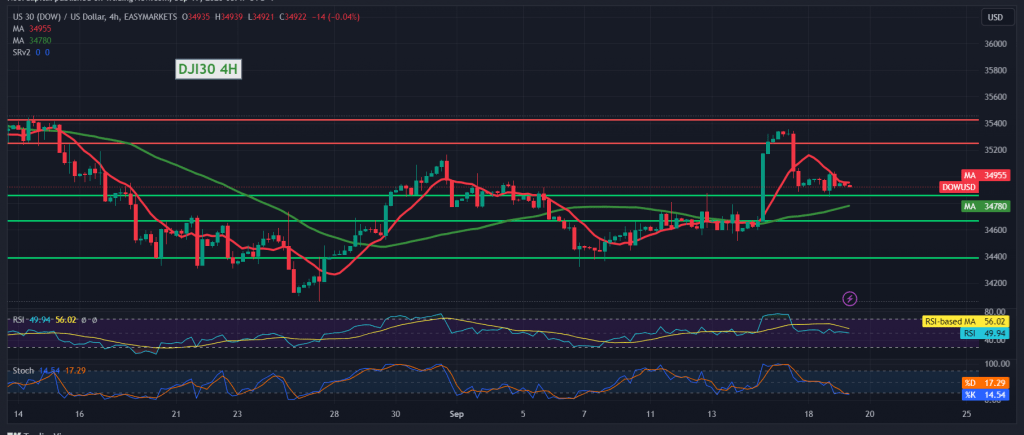
The Dow Jones Industrial Average on Wall Street failed to maintain positive stability for a long time above the 35,000 level, recording its highest level during the previous trading session at 35,040.
Technically, by looking at the 4-hour time frame chart, the Stochastic indicator has begun to gradually lose upward momentum, in addition to the price remaining below resistance 35,030 and most importantly 35,070.
Therefore, we tend toward negativity in our trading, but with caution, knowing that sneaking below 34,870 opens the door to visit 34,840 and then 34,750, a next station. Its bearish targets may extend later to visit 34,650.
We remind you that price consolidation above 35,030 and most importantly 35,070 will immediately stop the proposed bearish scenario and lead the index to recover with targets reaching 35,130 and 35,220.
Note: Risk level may be high.
Note: Trading on CFDs involves risks. Therefore, all scenarios may be possible. This article is not a recommendation to buy or sell but rather an explanatory reading of the price movement on the chart.
| S1: |