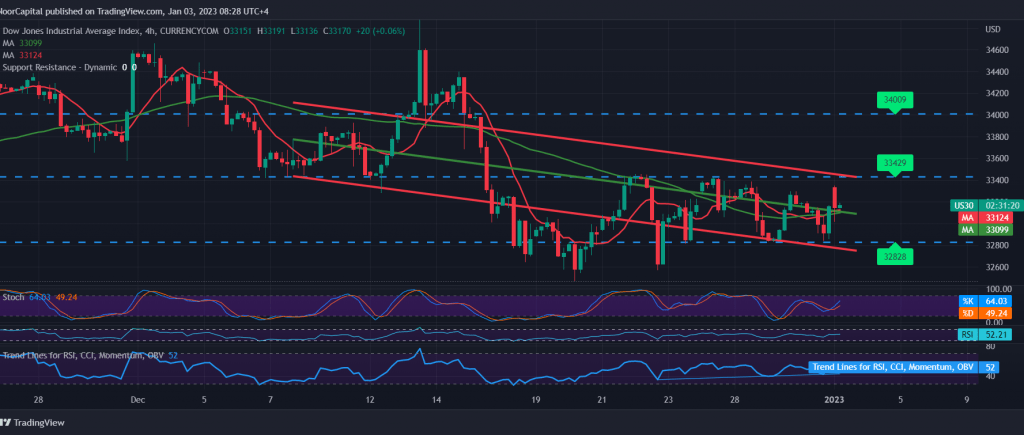
Mixed trading dominated the movements of the Dow Jones Industrial Average on Wall Street at the end of last year’s trading, ending last Friday’s trading around 33,157.
Technically, when looking closely at the chart, we notice a contradiction in the technical signals to find that the simple moving average supports the rise and is supported by the positive signs coming from the RSI, which contradicts the clear negativity features on the stochastic.
Because of the conflicting technical signals, we prefer to monitor the price behaviour of the index to be facing one of the following scenarios:
To get an upward trend, we need to witness the stability of the price above 33,020, which extends the index’s losses, to be waiting for a visit to 32,890. At the same time, the consolidation above 33,350 can consolidate the gains towards 33,405 33,430.
Note: The level of risk is high and not commensurate with the expected return.
Note: Trading on CFDs involves risks. Therefore, all scenarios may be possible. This article is not a recommendation to buy or sell but rather an explanatory reading of the price movement on the chart.
| S1: |
 Noor Trends News, Technical Analysis, Educational Tools and Recommendations

