
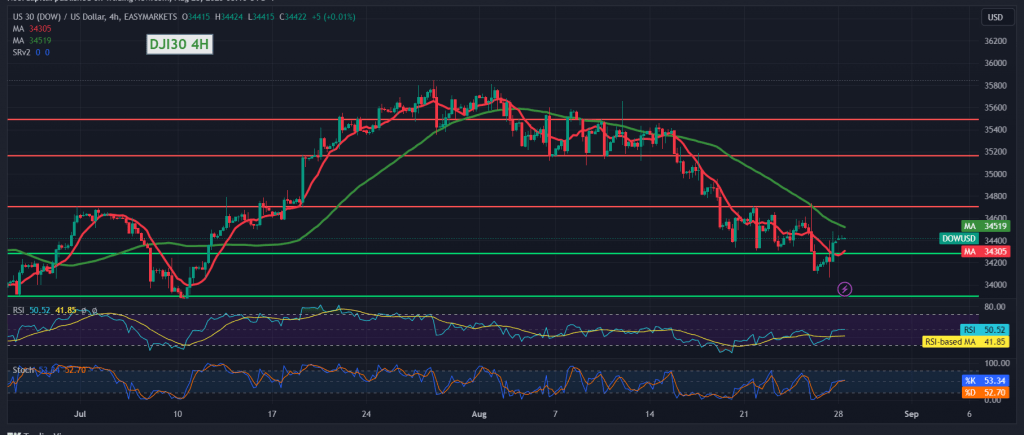
Negative trading dominated the movements of the Dow Jones Industrial Average on the New York Stock Exchange, within the gradual decline towards the target achieved at 34,000, only to record its lowest level at 34,060.
Technically, with a closer look at the 4-hour chart, we notice the continuation of the negative pressure coming from the simple moving averages, supporting the continuation of the bearish trend. On the other hand, we notice the index price stability above 34280, accompanied by the positive signs of the RSI.
We prefer to monitor the price behavior of the index to obtain a high-quality deal, waiting one of the following scenarios:
Confirmation of breaking 34,280 constitutes a negative pressure factor, targeting 34160 & 34,000, and losses may extend towards 33,900.
Consolidating the price above the resistance level of 34510 may lead the index to retest 34580 & 34690.
Note: the risk level may be high.
Note: Trading on CFDs involves risks. Therefore, all scenarios may be possible. This article is not a recommendation to buy or sell but rather an explanatory reading of the price movement on the chart.
| S1: |