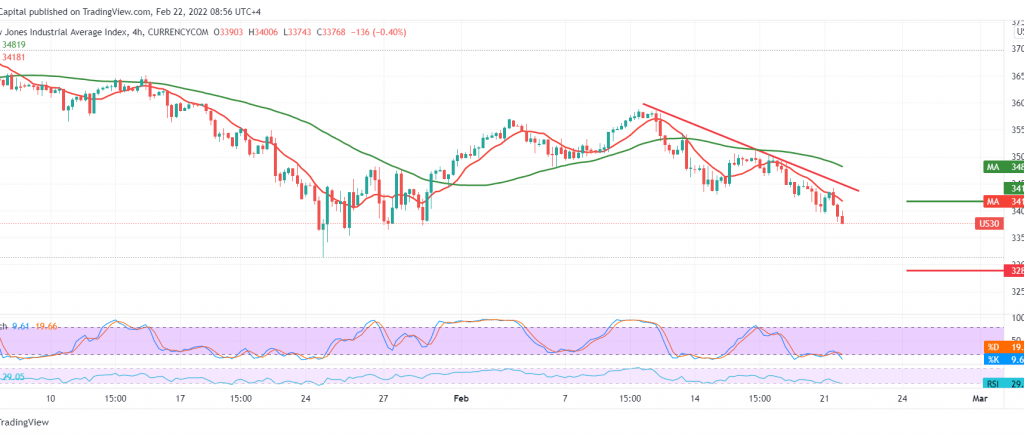
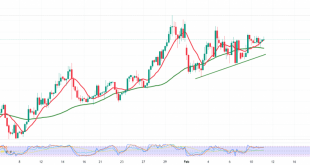
Negative trading dominated the movements of the Dow Jones Industrial Average movements within the expected bearish context, touching the first target of 33,400, heading towards the 2nd target of 33,200, recording a low of33,290.
Technically, by looking at the 60-minute chart, we find that there are some features of positive signals coming from the RSI, in addition to the intraday stability above 33,290, and this may lead the index to reduce its losses to retest the previously broken support-into-resistance of 34,040 before attempts to decline again.
Note: The slight bullish slope shown above does not contradict the official bearish trend, whose official targets are around 33,190 once 33,290 is broken.
Note: The risk level is high, and we may see volatile movements.
Note: CFD trading involves high risk; all scenarios may occur.
| S1: 33195 | R1: 34140 |
| S2: 32840 | R2: 34710 |
| S3: 32260 | R3: 35070 |
 Noor Trends News, Technical Analysis, Educational Tools and Recommendations

